
(T2108 measures the percentage of stocks trading above their respective 40-day moving averages [DMAs]. It helps to identify extremes in market sentiment that are likely to reverse. To learn more about it, see my T2108 Resource Page. You can follow real-time T2108 commentary on twitter using the #T2108 hashtag. T2108-related trades and other trades are occasionally posted on twitter using the #120trade hashtag. T2107 measures the percentage of stocks trading above their respective 200DMAs)
T2108 Status: 27.3%
T2107 Status: 25.4%
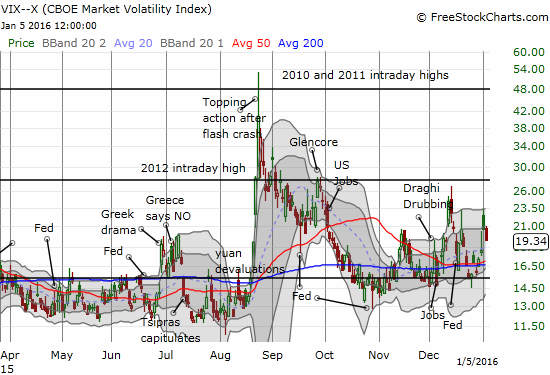
VIX Status: 19.3 (dropped from elevated conditions)
General (Short-term) Trading Call: bullish with a “very short leash”
Active T2108 periods: Day #14 over 20%, Day #2 under 30% (underperiod), Day #18 under 40%, Day #22 below 50%, Day #37 under 60%, Day #378 under 70%
Reference Charts (click for view of last 6 months from Stockcharts.com):
S&P 500 or SPY
SDS (ProShares UltraShort S&P500)
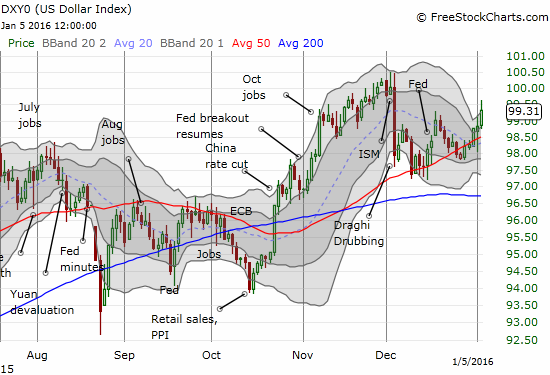
U.S. Dollar Index (volatility index)
EEM (iShares MSCI Emerging Markets)
VIX (volatility index)
VXX (iPath S&P 500 VIX Short-Term Futures ETN)
EWG (iShares MSCI Germany Index Fund)
CAT (Caterpillar).
IBB (iShares Nasdaq Biotechnology).
Commentary
Not liking what I see with big fades on stocks, surging Japanese yen. Despite near oversold conditions, moving on $UVXY for spec $AUDJPY
— Dr. Duru (@DrDuru) January 5, 2016
Bullish divergence: %stocks>40DMA is now above yesterday's high. Could drag $SPY upward kicking and screaming to extend relief rally.
— Dr. Duru (@DrDuru) January 5, 2016
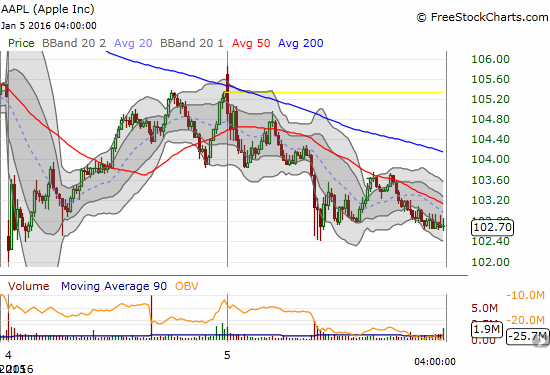
It was a choppy kind of day with a very mixed message. After an encouraging open, sellers quickly descended upon the market and generated alarming fades in some of the key stocks that I watch. The fade on Apple (AAPL) was a key tell for me at the time. It ended the day down 2.5% and almost completely wiped out the previous day’s nice bounce of oversold lows.
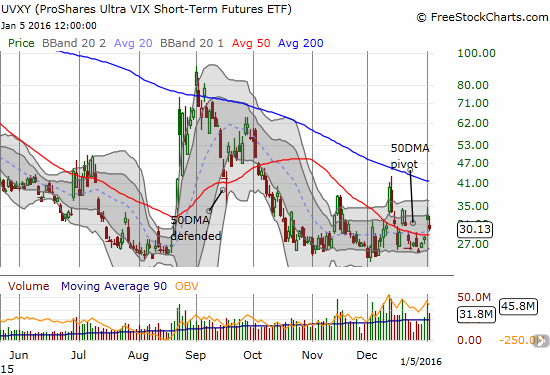
Given my wariness, I gave into the danger signs and actually purchased call options on ProShares Ultra VIX Short-Term Futures (UVXY). I also sold my shares in SVXY from the previous day’s trade on oversold conditions. As it turned out, my purchase of UVXY was close to the intraday high which poked into positive territory ever so briefly on the day.
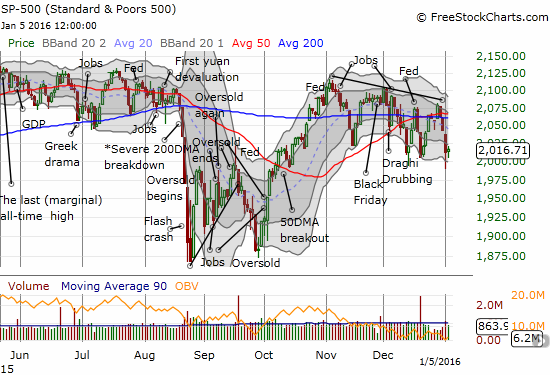
The end result of the day was a bullish divergence: T2108, the percentage of stocks trading above their respective 40-day moving averages (DMAs), closed with a solid 13% gain for the day while the S&P 500 (SPY) gained a VERY marginal 0.2%. It was one of those rare days in this market of deteriorating technicals where the typical leaders fared relatively poorly. Stocks like AAPL were a large drag on the indices. The NASDAQ fell 0.3%.
After seeing UVXY top out, I became emboldened once again to follow the T2108 oversold trading script. I got back into call options on AAPL and added to Netflix (NFLX) – which like AAPL faded hard from the open. I was of course surprised to see these titans close so poorly given the strength in T2108.
The Japanese yen (FXY) remains the big tell for me even as the U.S. dollar index is also regaining post-Fed momentum (as expected). The Australian dollar (FXA) versus the yen, AUD/JPY, is selling off anew at the time of writing. Just compare the current episode to the sell-off going into the August Angst to understand why I remain so wary even at these near-oversold conditions for T2108. AUD/JPY is a big reason for the very short leash I am maintaining on my T2108-related bullishness. I still like the pair as a key indicator of market sentiment (up is bullish, down is bearaish). This overnight breakdown could lead the way to a fresh dip into official oversold territory for T2108.
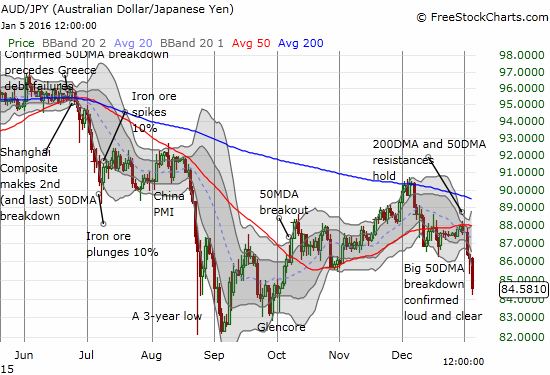
The strength of the yen is now looking over-stretched with yen currency pairs like AUD/JPY trading well below the lower-Bollinger Band. A sharp relief rally could occur at any moment. Such a move should drag stock indices upward as well. I stand ready on such a move to sell more bullish positions and then to fade the weakness of the yen by selling short GBP/JPY (Brtish pound versus the yen) all over again. With earnings season about to start, I am also favoring sticking with call options on UVXY until/unless the volatility index closes convincingly below the 15.35 pivot.
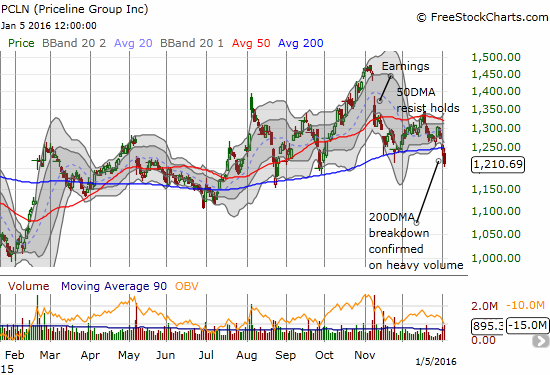
Priceline Group (PCLN) is a stock that I have not monitored in a very long time. Today, it made a potentially important breakdown below its 200DMA. This breakdown looks more ominous than the brief encounters through much of 2015 because it started with a large post-earnings gap down, a successful retest of 200DMA support, and a failed attempt to break 50DMA resistance. This has all the looks of failing momentum.
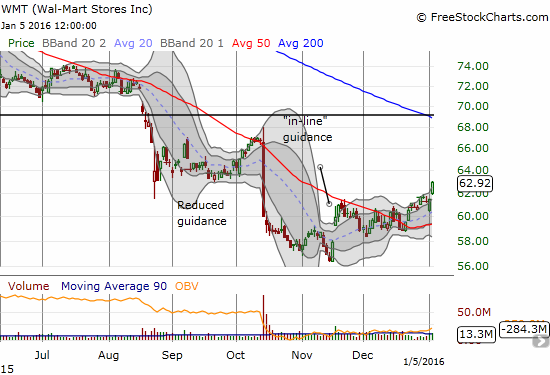
I will try to end on some kind of positive note with Wal-Mart Stores (WMT). At the end of December, I pointed to WMT as a potential bottom-fishing play. My limit order for long-term call options triggered on the previous day’s dip. Not only did WMT fully recover after that, the stock gained 2.4% today on its way to a fresh 2-month high. Buyers are definitely warming up on aisle WMT with that juicy 3.2% dividend yield.
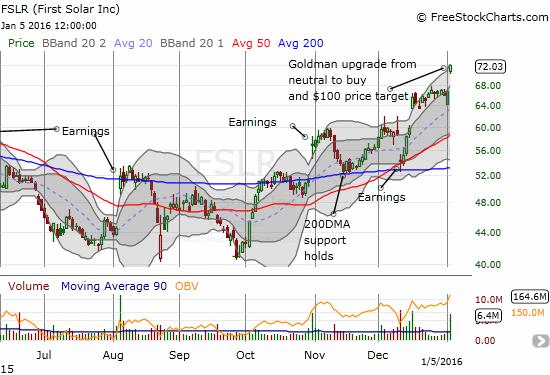
Finally, First Solar (FSLR) continues to prove out my bullish thesis on solar stocks. Goldman Sachs (GS) now agrees with me. GS’s upgrade sent FSLR hurtling upward to a whopping 8.0% close on the day and a near 16-month high. Unfortunately, the recent churn in the stock lulled me to sleep – I did not happen to have a position in play to catch this nice pop. I am definitely back on alert for the next entry point! (I am currently evaluating my select pick of solar stocks separate from whatever else is going on in the general market).
Daily T2108 vs the S&P 500
")
Black line: T2108 (measured on the right); Green line: S&P 500 (for comparative purposes)
Red line: T2108 Overbought (70%); Blue line: T2108 Oversold (20%)
Weekly T2108

*All charts created using freestockcharts.com unless otherwise stated
The charts above are the my LATEST updates independent of the date of this given T2108 post. For my latest T2108 post click here.
Related links:
The T2108 Resource Page
Expanded daily chart of T2108 versus the S&P 500
Expanded weekly chart of T2108
Be careful out there!
Full disclosure: long UVXY call options, long AAPL call options, short AUD/JPY, net long the U.S. dollar index