
(T2108 measures the percentage of stocks trading above their respective 40-day moving averages [DMAs]. It helps to identify extremes in market sentiment that are likely to reverse. To learn more about it, see my T2108 Resource Page. You can follow real-time T2108 commentary on twitter using the #T2108 hashtag. T2108-related trades and other trades are occasionally posted on twitter using the #120trade hashtag. T2107 measures the percentage of stocks trading above their respective 200DMAs)
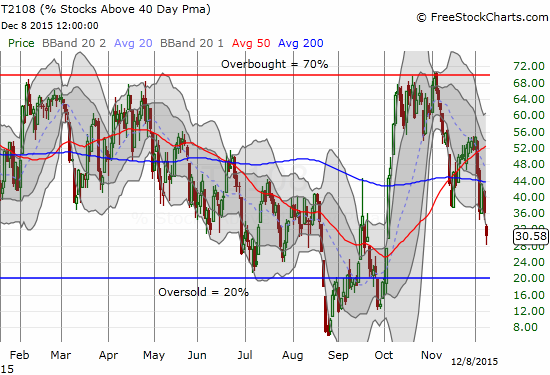
T2108 Status: 30.6%
T2107 Status: 29.3%
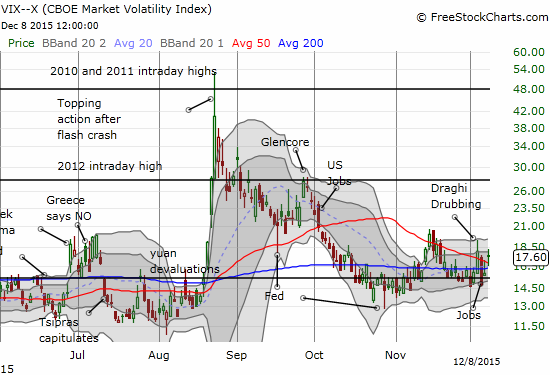
VIX Status: 17.6
General (Short-term) Trading Call: neutral
Active T2108 periods: Day #46 over 20%, Day #45 over 30% (overperiod), Day #2 under 40% (underperiod), Day #5 below 50%, Day #19 under 60%, Day #360 under 70%
Reference Charts (click for view of last 6 months from Stockcharts.com):
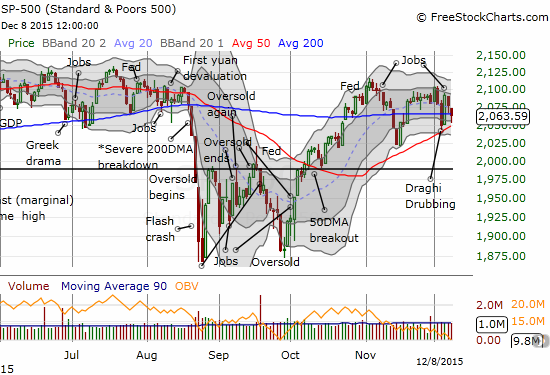
S&P 500 or SPY
SDS (ProShares UltraShort S&P500)
U.S. Dollar Index (volatility index)
EEM (iShares MSCI Emerging Markets)
VIX (volatility index)
VXX (iPath S&P 500 VIX Short-Term Futures ETN)
EWG (iShares MSCI Germany Index Fund)
CAT (Caterpillar).
IBB (iShares Nasdaq Biotechnology).
Commentary
%stocks>40DMA down to about 31% now. A 2-month low. With S&P 500 also approaching 50DMA support, potential short-term buy point. $SPY
— Dr. Duru (@DrDuru) December 8, 2015
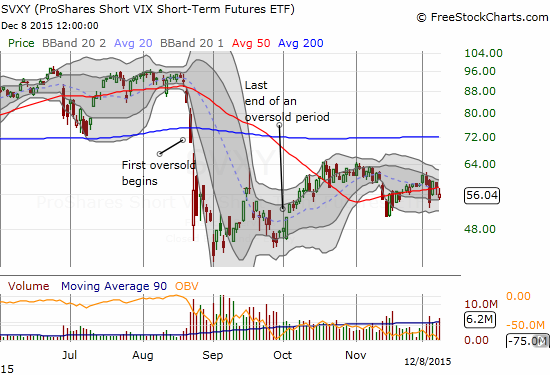
With my favorite technical indicator, T2108, stretched well below its lower-Bollinger Band (BB), I rushed to check the level of the S&P 500 (SPY). After I posted the above tweet, I immediately bought shares of ProShares Short VIX Short-Term Futures (SVXY) as my first play on a bounce. This has become my first step in my rule book for betting on short-term bounces. I also set a lowball buy order for call options on ProShares Ultra S&P500 (SSO).
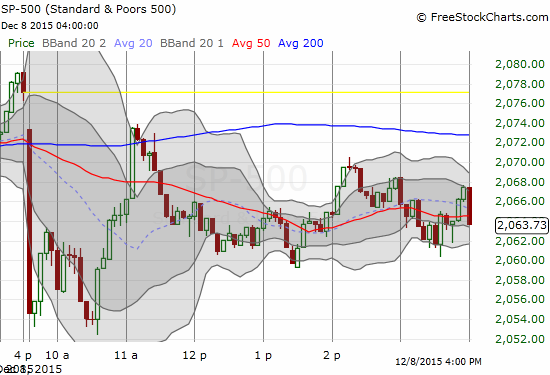
As regular readers know, once T2108 goes below 40%, I go on alert for “over-stretched” conditions. Below 30%, I am thinking about official oversold conditions. My order for call options never triggered as, quite to my surprise, the market quickly proceeded to bottom for the day. Even more amazing, SVXY soared $2 in rapid order. I quickly sold those shares for a quick gain. At the close of trading, the S&P 500 managed to close right on its 200DMA. However, SVXY retreated from presumed resistance at its 50DMA. The volatility index, the VIX, remains elevated above the 15.35 pivot point.
As has become my habit, I also looked at Netflix (NFLX) for a potential buy after I concluded odds favored a bounce in the market. The stock happened to be trading just above its uptrending 20DMA. I immediately bought call options as a play on this uptrend support. Fortuitously, NFLX began a slow and then accelerated march higher. I sold as my call options almost doubled in value. I am still holding call options from a purchase on the previous day. On that day, I was playing the previous uptrend channel defined by the upper-Bollinger Bands (BB). This trade worked like a charm on Friday, December 4th.
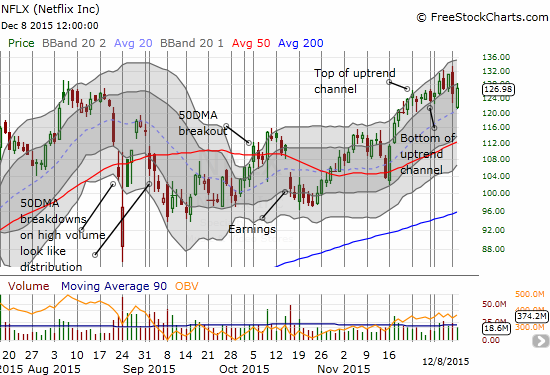
NFLX is part of the small collective of stocks holding up bullish sentiment in the market. The latest technical developments made me even more wary about the underlying health of the market. In the last T2108 Update, I pointed out how the divergence of performance between the S&P 500 and T2108 demonstrated a worrisome lack of breadth in the market. That divergence signaled what has become another two days of selling. This one-two-three punch of trading days is almost a carbon copy of the technical developments that unfolded over December’s first three trading days. THIS time, the difference in performance comes from the exaggerated move in T2108 relative to the S&P 500. The plunge in T2108 suggests that the S&P 500’s relatively mild decline is hiding an expanded range of underlying weakness.
In other words, while odds favor a bounce in the next day or two, the narrow market is not likely going to sustain the momentum.
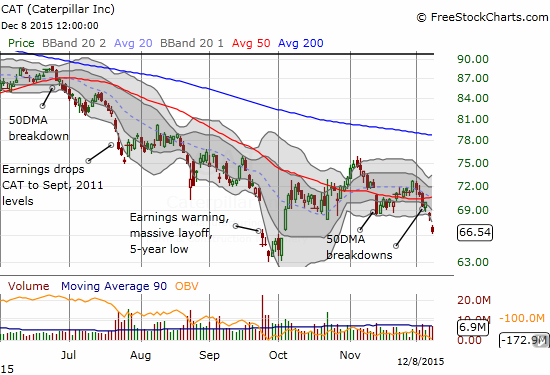
On the bearish side of the ledger, I closed out a series of put options and shorts after I concluded odds favored a short-term bounce. One of my more important short positions was in Caterpillar (CAT). The valiant recovery attempt by CAT since the large post-earnings gap down in October is coming to an end. Today’s gap down below the lower-BB confirms 50DMA as (approximate) resistance. This move is also a bit over-extended, so it made sense to lock in profits here. I am now waiting on the next opportunity to fade my favorite hedge against bullishness.
My stubborn short on Goldman Sachs (GS) looks ready to pay off. GS made a definitive gap down below its 50DMA support. This selling follows three days of wide churn where GS attempted to hold 50DMA support.
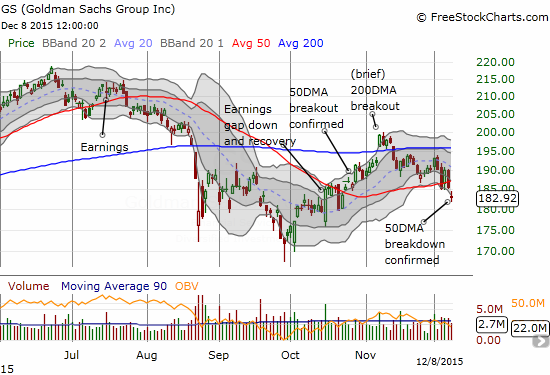
Until I get a new entry point to short CAT, GS becomes my new hedge against market bullishness.
Daily T2108 vs the S&P 500
")
Black line: T2108 (measured on the right); Green line: S&P 500 (for comparative purposes)
Red line: T2108 Overbought (70%); Blue line: T2108 Oversold (20%)
Weekly T2108

*All charts created using freestockcharts.com unless otherwise stated
The charts above are the my LATEST updates independent of the date of this given T2108 post. For my latest T2108 post click here.
Related links:
The T2108 Resource Page
Expanded daily chart of T2108 versus the S&P 500
Expanded weekly chart of T2108
Be careful out there!
Full disclosure: no positions