
(T2108 measures the percentage of stocks trading above their respective 40-day moving averages [DMAs]. It helps to identify extremes in market sentiment that are likely to reverse. To learn more about it, see my T2108 Resource Page. You can follow real-time T2108 commentary on twitter using the #T2108 hashtag. T2108-related trades and other trades are occasionally posted on twitter using the #120trade hashtag. T2107 measures the percentage of stocks trading above their respective 200DMAs)
T2108 Status: 27.4%
T2107 Status: 27.6%
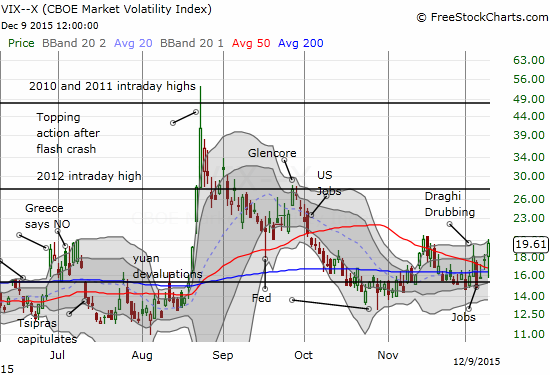
VIX Status: 19.6
General (Short-term) Trading Call: neutral – bullish bias
Active T2108 periods: Day #47 over 20% (overperiod), Day #1 under 30% (ending 45 days over 30%) (underperiod), Day #3 under 40%, Day #6 below 50%, Day #20 under 60%, Day #361 under 70%
Reference Charts (click for view of last 6 months from Stockcharts.com):
S&P 500 or SPY
SDS (ProShares UltraShort S&P500)
U.S. Dollar Index (volatility index)
EEM (iShares MSCI Emerging Markets)
VIX (volatility index)
VXX (iPath S&P 500 VIX Short-Term Futures ETN)
EWG (iShares MSCI Germany Index Fund)
CAT (Caterpillar).
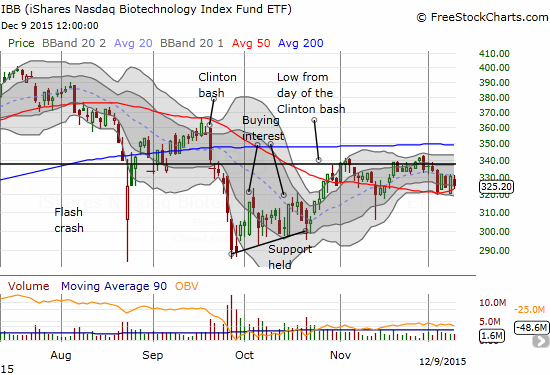
IBB (iShares Nasdaq Biotechnology).
Commentary
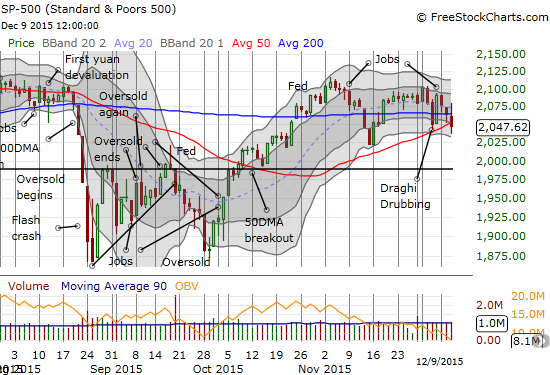
After a brief stumble, the S&P 500 (SPY) sprinted higher from the open. Shortly after the U.S. oil inventory report, trading quickly changed. The index dropped straight down for over two hours.
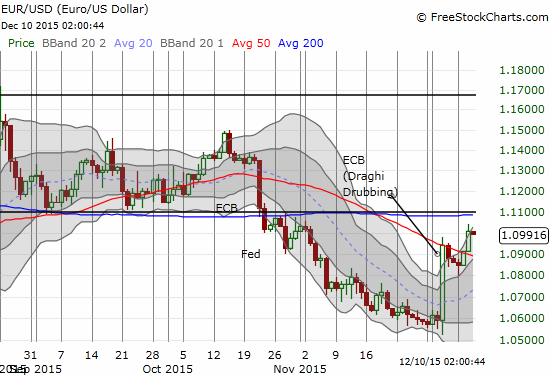
Could be entering new phase of selling as both euro and yen gain favor: aka more carry trades closing. $EURUSD $USDJPY #forex $SPY
— Dr. Duru (@DrDuru) December 9, 2015
The currency markets caught my eye before stocks because of the synchronized gains in the euro (FXE) and the yen (FXY) which suggested a major “risk off” move was underway. It took longer than I expected, but the euro made a definitive continuation move from last week’s Draghi Drubbing. With EUR/USD at 1.10 I sold my fist full of FXE call options for a 33% gain.
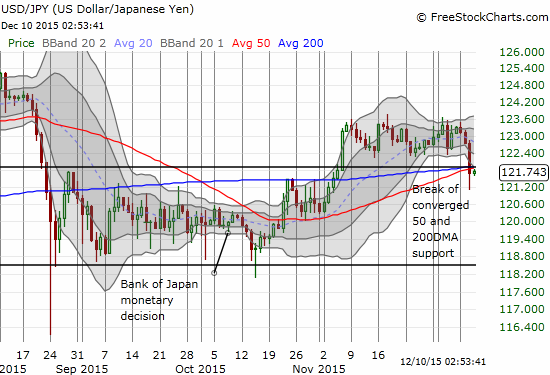
I am still overall bearish on the Japanese yen, especially against the U.S. dollar, so I used the dip in USD/JPY as an entry to my next trade. However, USD/JPY made an important break of support, so I am more wary than usual. The breakout from November is already over now.
The overall impact on the U.S. dollar left a lot of bruises. The U.S. dollar index is now staring down an important test of 50DMA support. Just last week the index was pushing against 12+ year highs and trading above 100.
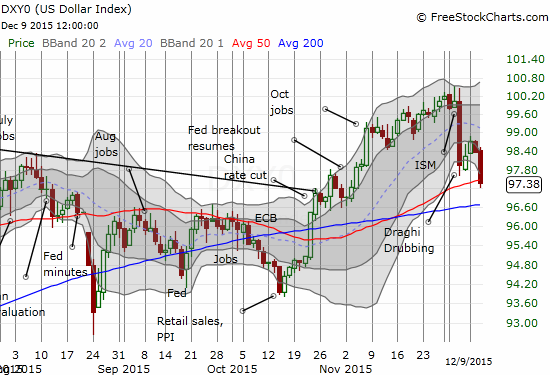
Note well that this sudden weakness in the U.S. dollar is unfolding despite the steady march toward near certainty in a Fed rate hike next week.
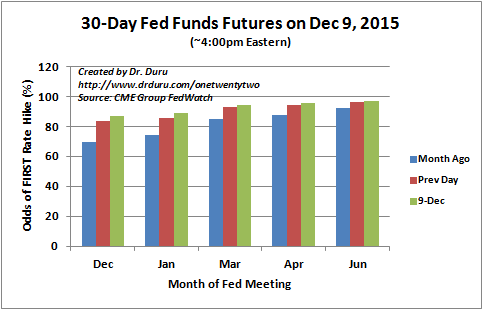
Source: CME Group FedWatch
As euro and yen strength appeared to suck the buying wind out the market, I checked on T2108. Much to my surprise, T2108 was hurtling toward oversold conditions. Such a move was NOT on my radar. In fact, in my last T2108 Update, I was bracing for another quick bounce back from recent selling even as I see an overall weakening of underlying technicals. Oversold trading conditions would substantially raise the stakes of the Fed’s big rate decision in a week!
Head-spinner: %stocks>40DMA down to about 25% now. Close to oversold levels!!! (<20%). #T2108 $SPY #VIX around 20%, officially "elevated"
— Dr. Duru (@DrDuru) December 9, 2015
I quickly went to the trading rule book and placed an order for shares in ProShares Short VIX Short-Term Futures (SVXY). That order filled quickly. The volatility index, the VIX, ended the day with an 11.4% gain after trading down toward recent lows. The VIX stopped just short of “elevated” levels starting at 20.
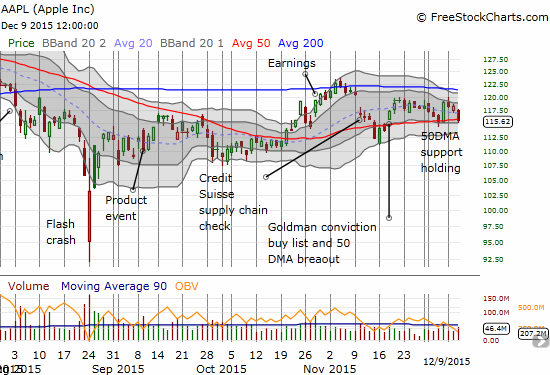
Next up, was Apple (AAPL). As a member of the privileged few leading the market higher, I liked the retest of the 50-day moving average support as a buying point. I ended up with two tranches of call options.
I did not reach for Netflix (NFLX) this time. It IS still on my radar of course, especially after the 20DMA uptrend held up for the second day in a row.
The S&P 500 ended the day with another modest loss. However, it closed marginally below its 50DMA support. The lows from November are now in play. Given December is typically a mild month – Fed rate hike notwithstanding – I am VERY intrigued by the possibilities of aggressively buying oversold conditions if they arrive. Fading pre-Fed volatility could be particularly lucrative this time around as well. With a first tranche of shares in SVXY in hand, my next trade will be to grab call options on ProShares Ultra S&P500 (SSO) as cheaply as I can. I am now on alert for an intraday trigger of oversold trading conditions – see my StockTwits and/or Twitter feeds for a near real-time alert.
Finally, two last charts.
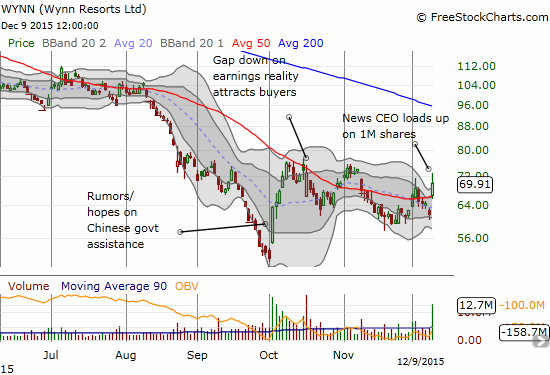
Wynn Resorts (WYNN) gapped up higher on news that the CEO loaded up on 1M shares in the open market between December 4th and the 8th. This purchase ups his stake by about 10% – substantial move. With 23% of the float sold short, this event could begin an important sentiment shift. Today was a good start with a 13% gain and a gap up that used the 50DMA as support. The stock still needs to clear recent highs in order to put an end to the most recent downtrend. I will interpret a close of this gap as a very bearish event and confirmation that the downtrend remains well intact.
The iShares Nasdaq Biotechnology (IBB) has held up better than the overall market in recent days. For five straight days, IBB has churned right above 50DMA support. After twice failing in November to finish a reversal of the Clinton Bash, this battle at support becomes very important. A clean breakdown would be very bearish and would put the lows of September and October back into play.
Daily T2108 vs the S&P 500
")
Black line: T2108 (measured on the right); Green line: S&P 500 (for comparative purposes)
Red line: T2108 Overbought (70%); Blue line: T2108 Oversold (20%)
Weekly T2108

*All charts created using freestockcharts.com unless otherwise stated
The charts above are the my LATEST updates independent of the date of this given T2108 post. For my latest T2108 post click here.
Related links:
The T2108 Resource Page
Expanded daily chart of T2108 versus the S&P 500
Expanded weekly chart of T2108
Be careful out there!
Full disclosure: long SVXY shares, net long the U.S. dollar index, net short the euro, long and short various positions against the Japanese yen, long IBB call options