
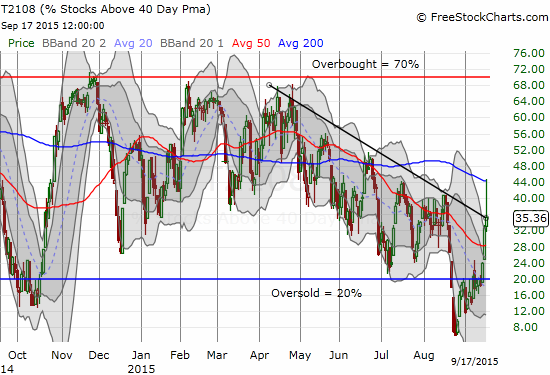
(T2108 measures the percentage of stocks trading above their respective 40-day moving averages [DMAs]. It helps to identify extremes in market sentiment that are likely to reverse. To learn more about it, see my T2108 Resource Page. You can follow real-time T2108 commentary on twitter using the #T2108 hashtag. T2108-related trades and other trades are occasionally posted on twitter using the #120trade hashtag. T2107 measures the percentage of stocks trading above their respective 200DMAs)
T2108 Status: 35.4%
T2107 Status: 25.7%
VIX Status: 21.1
General (Short-term) Trading Call: Bullish
Active T2108 periods: Day #3 over 20%, Day #2 over 30% (overperiod), Day #22 under 40%, Day #83 under 50%, Day #100 under 60%, Day #298 under 70%
Reference Charts (click for view of last 6 months from Stockcharts.com):
S&P 500 or SPY
SDS (ProShares UltraShort S&P500)
U.S. Dollar Index (volatility index)
EEM (iShares MSCI Emerging Markets)
VIX (volatility index)
VXX (iPath S&P 500 VIX Short-Term Futures ETN)
EWG (iShares MSCI Germany Index Fund)
CAT (Caterpillar).
Commentary
Newsflash. Fed leaves rates unchanged. Just as Fed Futures have predicted for many, many weeks now despite punditry out there. $SPY $TLT
— Duru A (@DrDuru) Sep. 17 at 11:02 AM
The much anticipated Fedageddon, the September 17th decision on monetary policy from the Federal Reserve, was fundamentally anti-climactic. The market’s reaction did not turn the bullish thesis on its head, but it did create some very important technical setups.
T2108 surged as high as 44.8% before settling for a 35.4% close. I redrew the downtrend line in the chart below to match closes and emphasize how T2108 retreated from an extremely bullish breakout.
The S&P 500 (SPY) followed the same pattern but it closed DOWN on the day. The negative close planted the S&P 500 right on top of former resistance now support from the highs formed during the oversold periods. The drop looks bearish but the better performance from T2108 forms a kind of bullish divergence. Moreover, the lower part of the former wedge is still sitting below ready to provide support.
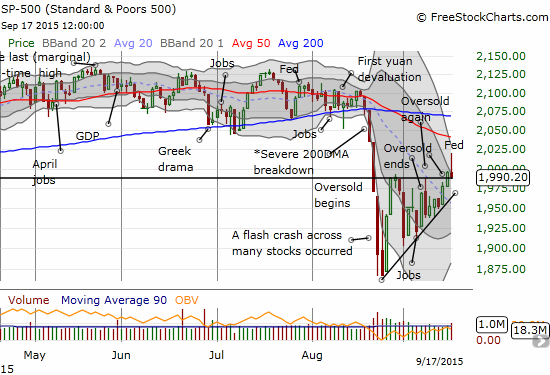
Note VERY well that a Bollinger Band (BB) squeeze is starting to form on the S&P 500. The stakes are very high for the resolution of this squeeze. I am still leaning toward a retest of 50DMA resistance and then the 200DMA in coming weeks (or less).
While the drama on the indices was interesting, I was mostly focused on volatility and currencies.
The volatility index, the VIX, experienced a very dramatic swing on the day.
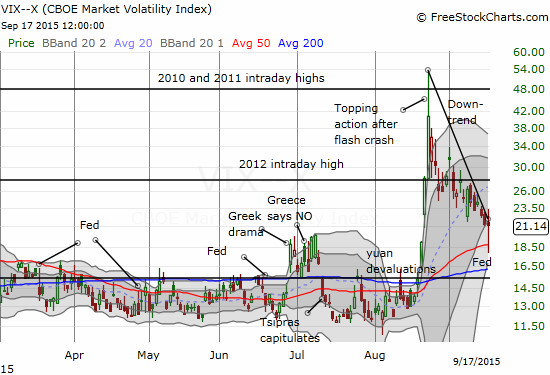
Some pundits place a lot of importance on 20 for the VIX. Above this level the VIX is elevated. So, it is notable that the VIX was pushed well below that threshold – at one point it traded at 17.9. A close at 17.9 would have marked a 15% plunge. Instead, the VIX bounced almost as sharply as it dropped. The end result for ProShares Ultra VIX Short-Term Futures (UVXY) was the successful defense of 50DMA support that I anticipated in the previous T2108 Update.
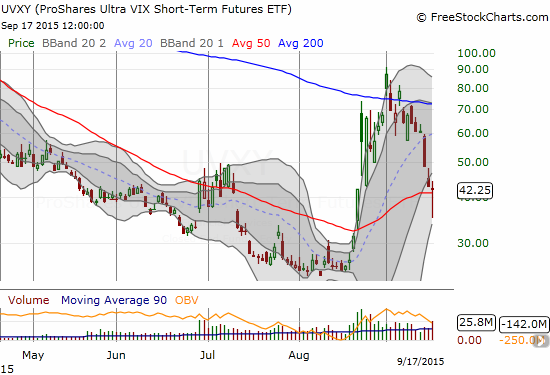
I am watching closely for follow-through. At “best,” UVXY could make one more run for 200DMA resistance, but a fresh catalyst needs to come along. Without a fresh catalyst, UVXY will very quickly return to the downtrend that defined its misery ahead of the flash crash of late August.
I did not get the pre/post-Fed surge in volatility that I wanted to fade. I did the next best thing and bought put options near the close of UVXY as a fade on the recovery from the day’s low. Whether or not this latest tranche of UVXY puts works, I will remain focused on fading UVXY going forward.
In currencies, the swings were as wild as volatility’s swings. Here is an intraday chart of the Australian dollar (FXA) versus the U.S. dollar (aka AUD/USD).
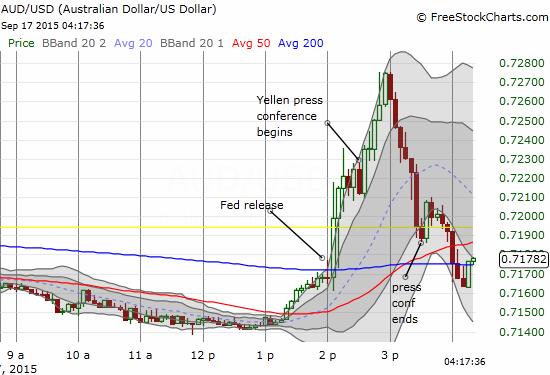
At the start of post-decision trading, the market seemed confused, so I did little. My main money-making currency trades came once I made my own assessment of the Fed’s decision as the subsequent press conference rolled along (see “An Anti-Climactic Fed Meeting On The Path Of Policy Normalization” for a complete rundown of my assessment). The swings in individual currency pairs provided a lot of quick entry and exit opportunities.
My prelim Fedageddon assessment: No material change in Fed's approach, just no hike now. Opp to buy $USDX and fade commodity lifts. #forex
— Duru A (@DrDuru) Sep. 17 at 12:05 PM
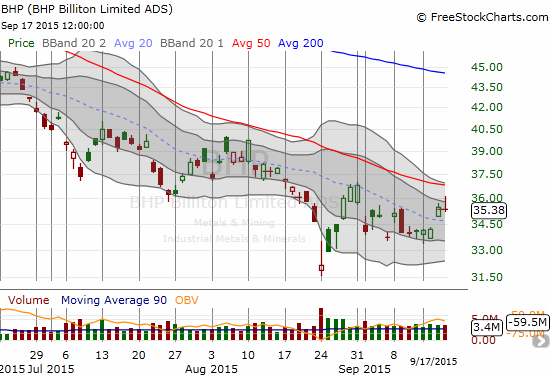
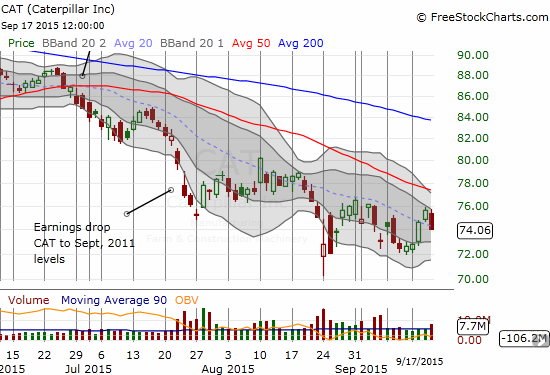
On the stock side, I faded BHP Billiton Limited (BHP) for a commodity play. I was further emboldened after seeing Caterpillar (CAT) trapped in an on-going sell-off that did not pause for the Fed’s announcement.
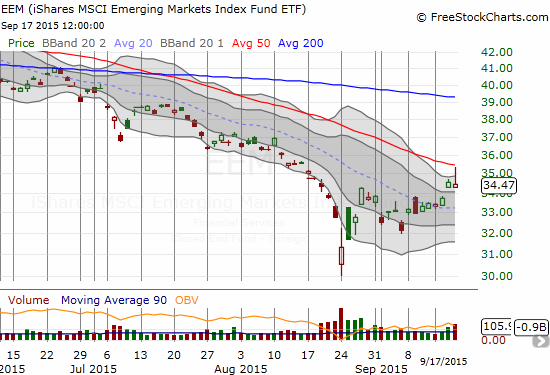
My assessment also compelled me to lock in my profits on my call options on the iShares MSCI Emerging Markets (EEM) as it was retesting 50DMA resistance. This decision turned out to be a timely one. I will still end up with a small net loss on the EEM strangle (out of the money put and call options) given I held the puts as an on-going hedge even after they became quite profitable.
I stand ready to reset my EEM trade.
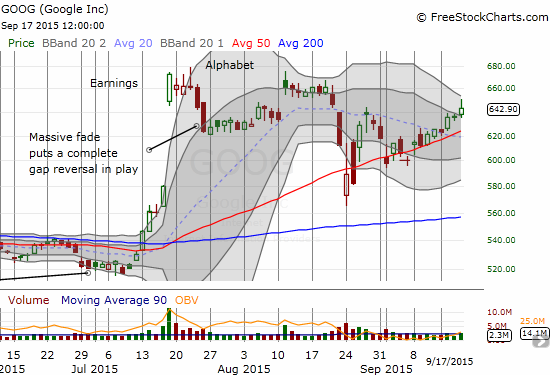
My big miss is now Google (GOOG, GOOGL). I simply never got a good entry point. The stock continues along a neat line for its post-crash recovery. The stock has broken out of the wedge formed by the 20 and 50DMAs. I hope to get a chance to enter on a “benign” pullback to 50DMA support.
I will leave further strategizing to a future post. Let’s see how the market trades post-Fed. The typical post-Fed fade involves reversing the move into the close of trading. I am inclined to do very quick trades for now until I can say with more technicals that the bullish thesis indeed remains intact. For T2108, I still think it is done thrashing in oversold territory for a while. I will not be surprised if I am soon counting down to OVERBOUGHT territory. If the stars align, this will happen as the S&P 500 is retesting a key resistance level.
Daily T2108 vs the S&P 500
")
Black line: T2108 (measured on the right); Green line: S&P 500 (for comparative purposes)
Red line: T2108 Overbought (70%); Blue line: T2108 Oversold (20%)
Weekly T2108

*All charts created using freestockcharts.com unless otherwise stated
The charts above are the my LATEST updates independent of the date of this given T2108 post. For my latest T2108 post click here.
Related links:
The T2108 Resource Page
Expanded daily chart of T2108 versus the S&P 500
Expanded weekly chart of T2108
Be careful out there!
Full disclosure: long SVXY shares, long SSO shares, long EEM puts, long CAT puts, net short the Australian dollar