
(T2108 measures the percentage of stocks trading above their respective 40-day moving averages [DMAs]. It helps to identify extremes in market sentiment that are likely to reverse. To learn more about it, see my T2108 Resource Page. You can follow real-time T2108 commentary on twitter using the #T2108 hashtag. T2108-related trades and other trades are occasionally posted on twitter using the #120trade hashtag. T2107 measures the percentage of stocks trading above their respective 200DMAs)
T2108 Status: 32.6% (one month high)
T2107 Status: 25.3% (highest close since flash crash on 8/24/15)
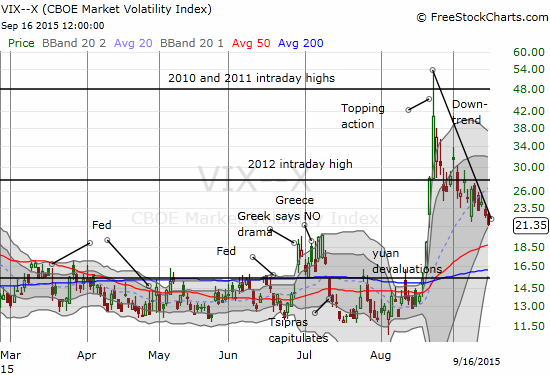
VIX Status: 21.4
General (Short-term) Trading Call: Bullish
Active T2108 periods: Day #2 over 20%, Day #1 over 30% (ending 18 days under 30% – a correction from previous posts), Day #21 under 40% (correction from previous posts), Day #82 under 50%, Day #99 under 60%, Day #297 under 70%
Reference Charts (click for view of last 6 months from Stockcharts.com):
S&P 500 or SPY
SDS (ProShares UltraShort S&P500)
U.S. Dollar Index (volatility index)
EEM (iShares MSCI Emerging Markets)
VIX (volatility index)
VXX (iPath S&P 500 VIX Short-Term Futures ETN)
EWG (iShares MSCI Germany Index Fund)
CAT (Caterpillar).
Commentary
Financial markets continue to surprise me. In the last T2108 Update announcing the end of the last oversold period, I guessed that the S&P 500 (SPY) would make no further progress until the conclusion of the Fed’s coming decision on monetary policy. Instead, markets seem to be rolling out a welcome mat for the decision. Calling the coming event “Fedageddon” even sounds like a bad misnomer now. The S&P 500 gained 0.9%, and T1208 closed with a VERY strong surge to 32.6% from 23.9%. This follow-through day essentially confirms that the market is likely done with agonizing and thrashing in an oversold period for a while.
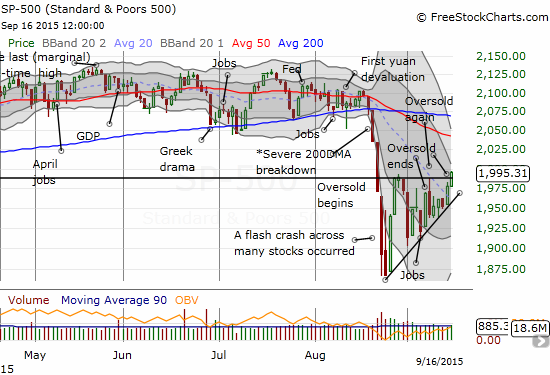
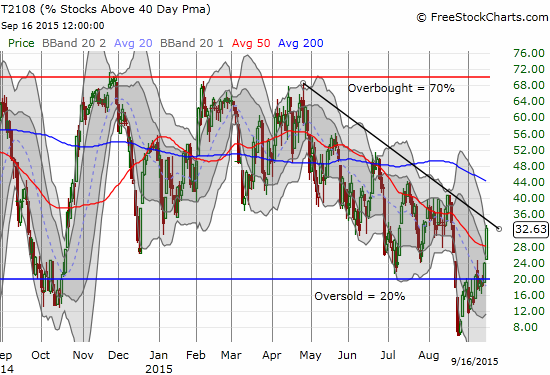
I cannot over-emphasize the (short-term) bullish potential of both these moves given everything the market has conquered over the past month. The S&P 500 has now broken out to the upside from a rising wedge pattern. The index looks like a lock to challenge overhead resistance at the downtrending 50-day moving average (DMA) in short order. A test of that critical resistance will coincide with the open of the first day of the first oversold period. Just as I used the downtrend in T2108 (and T2107) as warnings of weakening underlying technicals, a breakout by T2108 of its downtrend would generate an incredibly bullish signal for the underlying technicals of the market. As usual, I will take it a day at a time, but I just wanted to note that I am on alert.
And, yes, the Federal Reserve could spurn this welcome mat and spoil the party, but such an act would go against the Fed’s typical behavior in the post-crisis world.
The volatility index, the VIX, is underlining and highlighting the welcome mat. It continues to slide sharply along a downtrend line. One little nudge by the Fed could plunge the VIX right back into the range that was comfortably churning for months before August.
Accordingly, ProShares Ultra VIX Short-Term Futures (UVXY) continued its hurtle back to earth. UVXY lost 12.2% on the day and continues to confirm its readiness to return to the typical misery of its longstanding downtrend. I am definitely regretting closing out my last tranche of UVXY put options at the open of the previous day! That is a LOT of profit I left on the table.

If the bears have any fight left in them, I expect them to try to hold the line at UVXY’s 50DMA. Maybe even engineer a final bounce.
The welcome mat is even showing up in emerging markets.
The iShares MSCI Emerging Markets (EEM) has broken out to a one-month high. I am of course looking back and marveling at how I decided to hold onto my put options as one of my remaining short positions and on-going hedge after the flash crash. Now, those puts are likely to end life at zero this Friday, and my EEM call options are going to soon double in value (readers recall that I like to set up call/put option combinations on EEM, a strategy called a strangle). I am going to do my best to hold onto those calls (expiration in October).

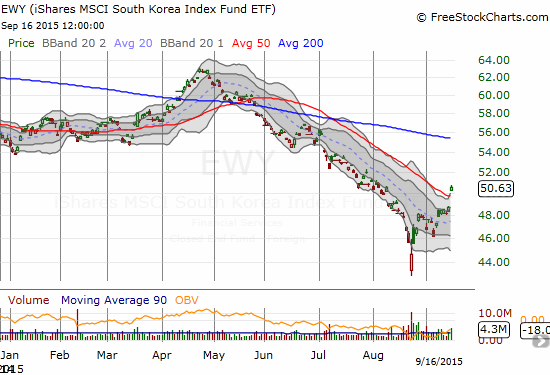
The iShares MSCI South Korea Capped (EWY) is a play I am still holding from the first oversold period. This is about as bullish a breakout from a low as I could want. The primary downtrends from the 20DMA and now 50DMA are over.
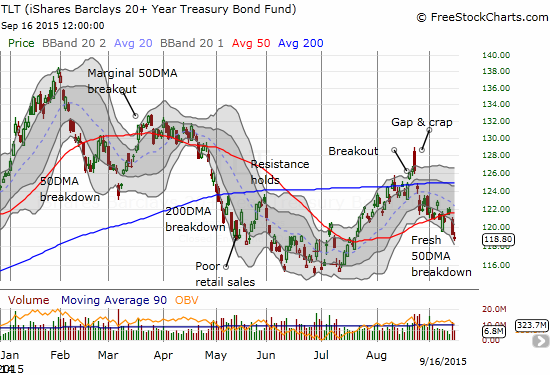
Finally, interest rates are on the rise again. My call spread on iShares 20+ Year Treasury Bond (TLT) looked brilliant for a hot minute during the flash crash. Like the EEM put options, I decided to hang onto the position as a hedge on all the bullish trades I was making to take advantage of the oversold period. Unless the Fed does something really extreme, my call spread will expire worthless.
Time to stop writing and time to start buckling up!!!
Daily T2108 vs the S&P 500
")
Black line: T2108 (measured on the right); Green line: S&P 500 (for comparative purposes)
Red line: T2108 Overbought (70%); Blue line: T2108 Oversold (20%)
Weekly T2108

*All charts created using freestockcharts.com unless otherwise stated
The charts above are the my LATEST updates independent of the date of this given T2108 post. For my latest T2108 post click here.
Related links:
The T2108 Resource Page
Expanded daily chart of T2108 versus the S&P 500
Expanded weekly chart of T2108
Be careful out there!
Full disclosure: long SVXY shares, long SSO shares, long TLT put spread, long EWY calls, long EEM calls and puts
I agree with the idea of shorting TLT, but as far as the mechanism goes, rather than doing so, which means you must pay the interest TLT pays (minimal, but still), or suffering the deterioration of TLT puts over time, why not go long TBT? After all, that’s what it’s for.
Going long TBT would be my preferred way to go. Although it has “friction” over time as well given it has to match 2x the inverse of TLT’s daily performance (and not the performance over time). Either way, I would only make bearish bet if the Fed set out on an aggressive rate hiking campaign which I don’t expect.