
(T2108 measures the percentage of stocks trading above their respective 40-day moving averages [DMAs]. It helps to identify extremes in market sentiment that are likely to reverse. To learn more about it, see my T2108 Resource Page. You can follow real-time T2108 commentary on twitter using the #T2108 hashtag. T2108-related trades and other trades are occasionally posted on twitter using the #120trade hashtag. T2107 measures the percentage of stocks trading above their respective 200DMAs)
T2108 Status: 14.3%
T2107 Status: 19.8%
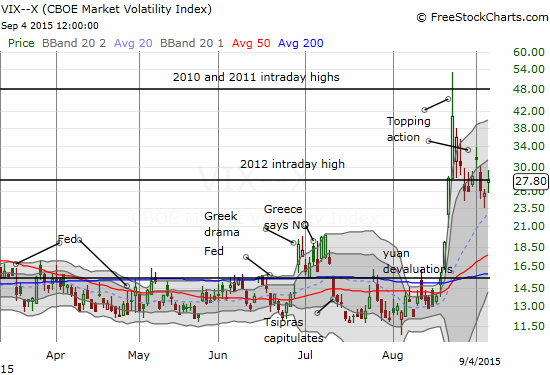
VIX Status: 27.8
General (Short-term) Trading Call: Bullish
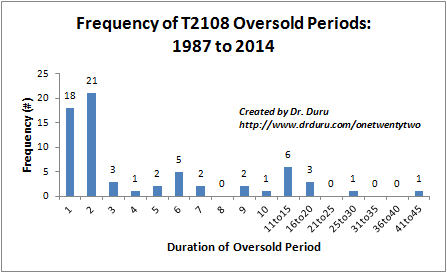
Active T2108 periods: Day #11 below 20% (oversold), Day #12 under 30%, Day #35 under 40%, Day #75 under 50%, Day #92 under 60%, Day #290 under 70%
Reference Charts (click for view of last 6 months from Stockcharts.com):
S&P 500 or SPY
SDS (ProShares UltraShort S&P500)
U.S. Dollar Index (volatility index)
EEM (iShares MSCI Emerging Markets)
VIX (volatility index)
VXX (iPath S&P 500 VIX Short-Term Futures ETN)
EWG (iShares MSCI Germany Index Fund)
CAT (Caterpillar).
Commentary
One of the many urban legends on Wall Street involves trading after the U.S. Labor Day holiday. Supposedly, traders and major investors take the summer off, commonly defined as the period between Memorial Day in late May and Labor Day in early September. During this period, liquidity is poor and the market gyrates aimlessly and unprofitably. Once the big guys, the “serious money”, return after Labor Day, we get a true feel for the market’s inclinations. I last covered the data on this trade way back in 2007 on my old site, so it is due for a SERIOUS update. Here are the most relevant conclusions from that time:
- The performance of the S&P 500 for the year up to Labor Day is very highly correlated with the year-over-year performance of the index. In other words, if the S&P 500 is positive for the year up to Labor Day, then we are almost guaranteed to have an up year overall. This correlation is far more important than the daily trade the day following Labor Day.
- The relationship of the one-day post-Labor Day gains to other time periods of the year has been remarkably consistent throughout 44-year sample.
- The market tends to perform better over time than the single day trade on the day following Labor Day. Of course, the longer the time frame, the more likely performance will exceed that of any given day.
In other words, I did discover enough evidence to indicate that Labor Day is some kind of important marker. If point #1 holds, 2015 will end as a rare post-crisis down year. The current breakdown in the S&P 500 (SPY) seems severe enough to at least prevent the index from notching a new all-time high this year.
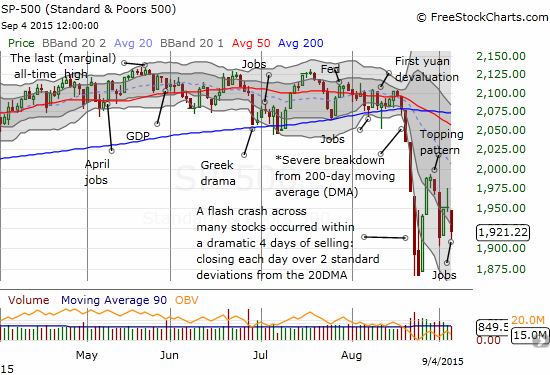
The S&P 500 ended trading Friday with a loss of 1.5% in the wake of the U.S. jobs report for August. I do not think it definitively resolved the debate over the timing of the Fed’s lift-off for rates. Regardless, for anyone who actually took a break from the financial markets over the summer (in this day and age of full and ubiquitous connectivity, I am highly doubtful any serious manager of money takes summers completely off), s/he either will return to the desk on Tuesday morning in a panic ready to sell or will jump up in excitement at all the “bargains” that abound. This stylized characterization of market participants could define the battle lines of the week as the countdown to what I will now call “Fedageddon” (Fed + Armageddon – a play on the now often used Armageddon/apocalypse meme attached to the dramas of the modern age) officially counts down through its most anxious moments.
The jobs news sure did not do anything for the current oversold period. T2108 declined back to 14.3% and extended the oversold period to 11 days. If the oversold period does not end this week, T2108 will enter VERY rarefied territory. Given the extended angst over the Fed’s decision next week – Fedageddon- I am now fully braced for the prospect of the oversold period lasting until the Fed issues its judgement.
Volatility ended the week right on the edge of the “dangerzone.” If the oversold period languishes on, I fully expect volatility to get fresh life. I will continue to favor fading volatility during this oversold period, ESPECIALLY ahead of the Fed meeting.
Here are my trading highlights from Friday, another “slow” day given T2108 trading rules did not trigger: sold last round of Caterpillar (CAT) puts at a modest profit and watched an earlier batch expire worthless – I will continue to look for opportunities to fade CAT as a small hedge against longs; a limit order to buy a small number ProShares Ultra S&P500 (SSO) call options triggered; bought shares in Direxion Daily Energy Bear 3X ETF (ERY) as a 2-for-1 hedge on market longs AND a bet that oil will weaken going into the Fed meeting (I am saving bets against oil for later in case oil surprises me and trades higher this week) – ERY also has a very nice uptrend going; and doubled down on current short-term bet against volatility with put options on ProShares Ultra VIX Short-Term Futures (UVXY); {late addendum} – I watched my Google (GOOG) call option go to waste. It turned out to be an excellent trade. But in my greed, I failed to take profits when I had them!
Daily T2108 vs the S&P 500
")
Black line: T2108 (measured on the right); Green line: S&P 500 (for comparative purposes)
Red line: T2108 Overbought (70%); Blue line: T2108 Oversold (20%)
Weekly T2108

*All charts created using freestockcharts.com unless otherwise stated
The charts above are the my LATEST updates independent of the date of this given T2108 post. For my latest T2108 post click here.
Related links:
The T2108 Resource Page
Expanded daily chart of T2108 versus the S&P 500
Expanded weekly chart of T2108
Be careful out there!
Full disclosure: long SVXY shares, long SSO shares and call options, long ERY, long UVXY put options