
(T2108 measures the percentage of stocks trading above their respective 40-day moving averages [DMAs]. It helps to identify extremes in market sentiment that are likely to reverse. To learn more about it, see my T2108 Resource Page. You can follow real-time T2108 commentary on twitter using the #T2108 hashtag. T2108-related trades and other trades are occasionally posted on twitter using the #120trade hashtag. T2107 measures the percentage of stocks trading above their respective 200DMAs)
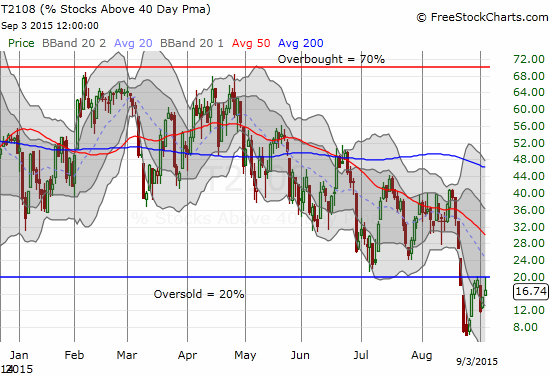
T2108 Status: 16.7% (intraday high of 19.99% – seriosuly!)
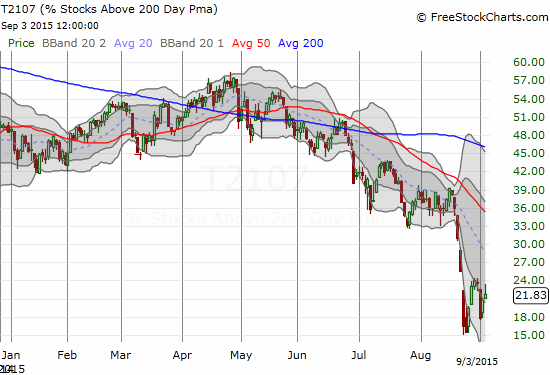
T2107 Status: 21.8%
VIX Status: 25.6
General (Short-term) Trading Call: Bullish
Active T2108 periods: Day #10 below 20% (oversold), Day #11 under 30%, Day #34 under 40%, Day #74 under 50%, Day #91 under 60%, Day #289 under 70%
Reference Charts (click for view of last 6 months from Stockcharts.com):
S&P 500 or SPY
SDS (ProShares UltraShort S&P500)
U.S. Dollar Index (volatility index)
EEM (iShares MSCI Emerging Markets)
VIX (volatility index)
VXX (iPath S&P 500 VIX Short-Term Futures ETN)
EWG (iShares MSCI Germany Index Fund)
CAT (Caterpillar).
Commentary
The upcoming and much-anticipated U.S. jobs report could completely alter the technical landscape, so I am keeping this T2108 Update short and sweet. (I know – finally!).
T2108 closed at 16.7% for a 10th straight day in oversold territory. Of 66 oversold periods since 1986, only 11 (17%) have lasted longer.
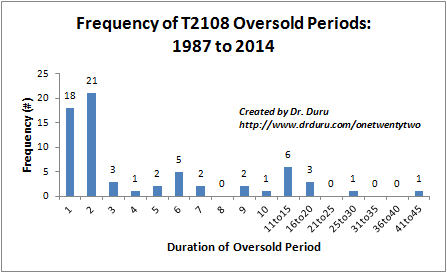
Given this stretch of time, it is only natural that T2108 continues to make moves to breakout and end the oversold period. Today, T2108 traded as high as 19.99% which is .01 percentage point away rom the oversold threshold – I just cannot make this stuff up.
T2107, the percentage of stocks trading above their 200-day moving averages (DMAs), also rose right to an important exit gate: a higher high that could have started an uptrend from recent lows.
At least the volatility index, the VIX, followed through on the topping action I pointed out in the last T2108 Update.
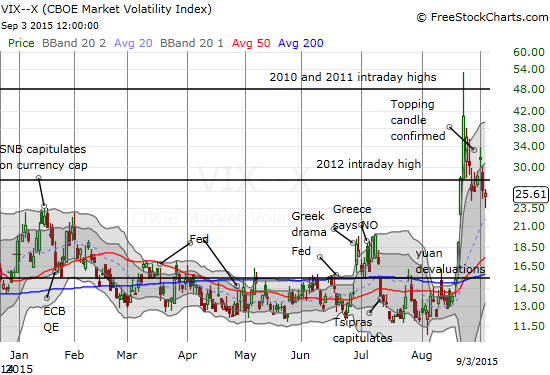
Note that the VIX remains elevated, so traders should continue to expect choppy markets. I am still expecting the VIX to remain elevated, say above 20, going into the Federal Reserve’s rate decision on September 17.
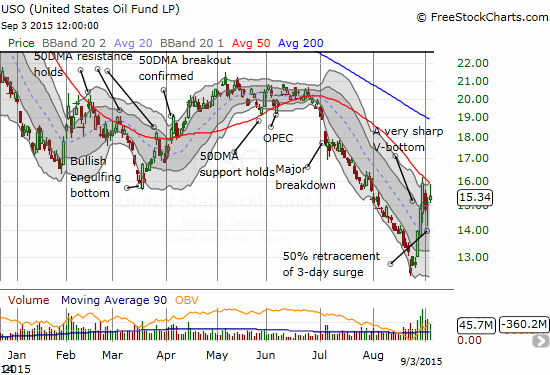
Finally, the United States Oil Fund (USO) made another attempt to break from resistance defined by the downward sloping 50DMA. Another decline in its volatility measure, the CBOE Crude Oil Volatility Index (OVX), increases the odds that the breakout will happen soon. My question: are higher oil prices good or bad for a fragile global economy…?
Given elevated volatility and lots of hand-wringing over what the Fed will do this month, I expect a major battle of interpretations in the wake of the U.S. jobs report…no matter what the numbers say. I fully expect Friday’s post-jobs trading to represent a microcosm of the larger day-to-day chop of this oversold period. With a long weekend ahead, those with short-term profits will likely look to lock those in. Those who continue to fear what the future holds will likely look to bail at an opportune time to stay “safe” over the extended time away from the market.
Daily T2108 vs the S&P 500
")
Black line: T2108 (measured on the right); Green line: S&P 500 (for comparative purposes)
Red line: T2108 Overbought (70%); Blue line: T2108 Oversold (20%)
Weekly T2108

*All charts created using freestockcharts.com unless otherwise stated
The charts above are the my LATEST updates independent of the date of this given T2108 post. For my latest T2108 post click here.
Related links:
The T2108 Resource Page
Expanded daily chart of T2108 versus the S&P 500
Expanded weekly chart of T2108
Be careful out there!
Full disclosure: long SVXY shares, long SSO shares and call options, short USO call spread, short USO put options