
(T2108 measures the percentage of stocks trading above their respective 40-day moving averages [DMAs]. It helps to identify extremes in market sentiment that are likely to reverse. To learn more about it, see my T2108 Resource Page. You can follow real-time T2108 commentary on twitter using the #T2108 hashtag. T2108-related trades and other trades are occasionally posted on twitter using the #120trade hashtag. T2107 measures the percentage of stocks trading above their respective 200DMAs)
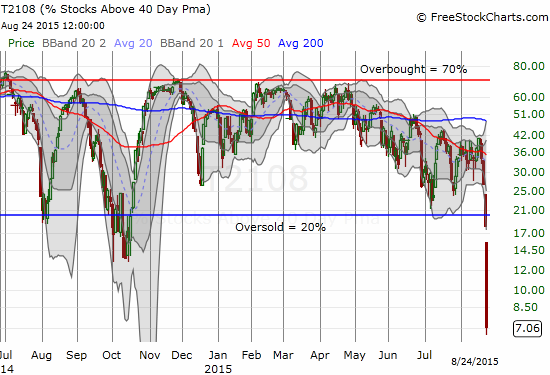
T2108 Status: 7.1% (a drop 61.0% from 18.1% ranks as third highest on record (since 1986). The two bigger plunges came from the crash of 1987. Now in fourth place is the plunge during the financial crisis on September 29, 2008.)
T2107 Status: 16.4% (a drop of 35.6% from 25.5%)
VIX Status: 40.7 (a jump of 45.3% that ranks as the fifth highest single-day gain since 1990. The VIX went up as much as 90% at the highs. That is NOT a typo – NINETY percent! )
General (Short-term) Trading Call: Bullish
Active T2108 periods: Day #2 below 20% (oversold), Day #3 under 30%, Day #26 under 40%, Day #66 under 50%, Day #83 under 60%, Day #282 under 70%
Reference Charts (click for view of last 6 months from Stockcharts.com):
S&P 500 or SPY
SDS (ProShares UltraShort S&P500)
U.S. Dollar Index (volatility index)
EEM (iShares MSCI Emerging Markets)
VIX (volatility index)
VXX (iPath S&P 500 VIX Short-Term Futures ETN)
EWG (iShares MSCI Germany Index Fund)
CAT (Caterpillar).
Commentary
Today was an epic sell-off for the ages. I heard comparisons to the crash of 1987, to the financial crisis of 2008 to 2009, and to the massive debt ceiling driven sell-off in 2011. From a technical standpoint, these are all adequate comparisons even if the fundamental backdrops are different.
I have organized this post to first talk about my standard trio: T2108, the S&P 500, and the VIX. Next up are individual stocks that demonstrate the wild nature of the trading. Third, some market commentary from the experts. All these points are context and backdrop for the punch/bottomline: how in the world to profit from the madness. I use examples from my trading on the day to show my approach and rules.
T2108 fell a whopping 61.0% from 18.1% to today’s close of 7.1%. This was the third largest percentage drop on record (I have data going back to 1986). The top two both come from the crash of 1987: October 19, 1987 delivered a 85.4% drop to 0.86 (yes, that is LESS than ONE, not a typo!) and October 16, 1987 delivered a 65% drop to 5.88. Now in fourth place is September 29, 2008 with a 60.2% drop to 8.8, similar to today.
The S&P 500 (SPY) swung through an incredible range. The index fell a whopping 3.9% or a loss that was even larger than Friday’s sell-off. This makes a VERY rare string of two straight days where the ENTIRE length of the sell-off occurred below the lower-Bolligner Band (BB). The market simply cannot (OK, SHOULD not) get more oversold than this! A year of hard-fought gains (measured from August, 2014) have been wiped away in less than a week.
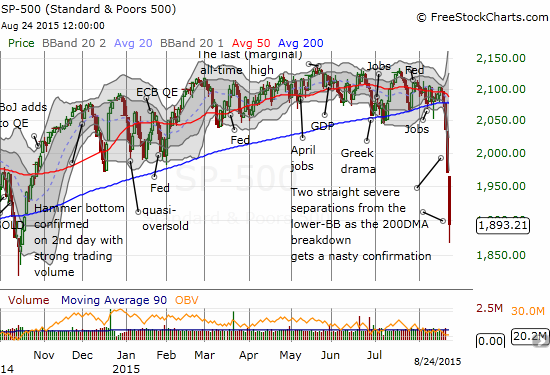
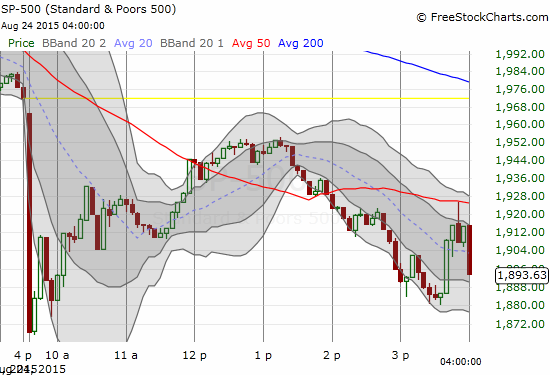
The daily chart hardly does justice to the swing of selling, buying, and more selling on the day. In fact, the gap down on the open is not clearly identified, probably partly as a result of a chaotic and slow open of the U.S. market. Here is the SPY ETF to show the real open followed by the 5-minute trading action.
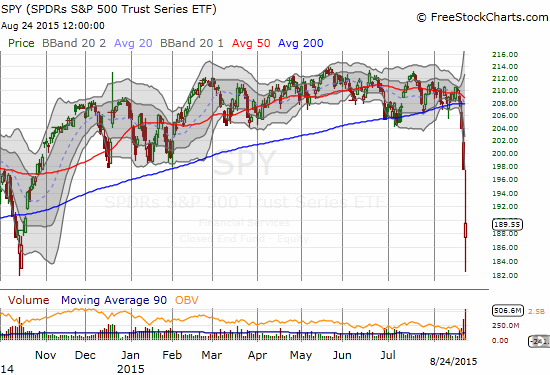
Note how the index actually managed to get tantalizingly close to a complete loss reversal.
Since the market movement was epic, volatility had to be epic as well! The VIX, the volatility index, closed at 40.7. This level was last seen during the 2011 sell-off. HOWEVER, the one-day increase of 45.3% ranks as the FIFTH largest since at least 1990 (I have data that far back). Incredibly, the VIX was up as much as 90% at it highs! That level of 53.9 was last seen….right around the historic March, 2009 lows. Talk about epic.
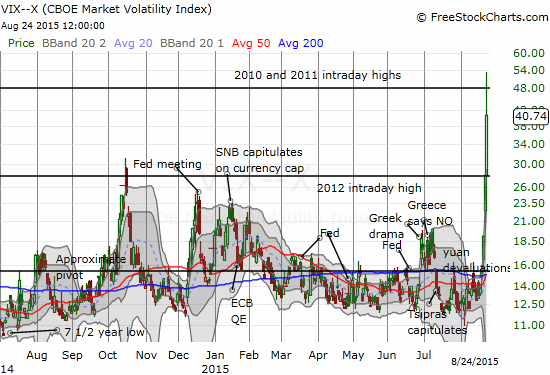
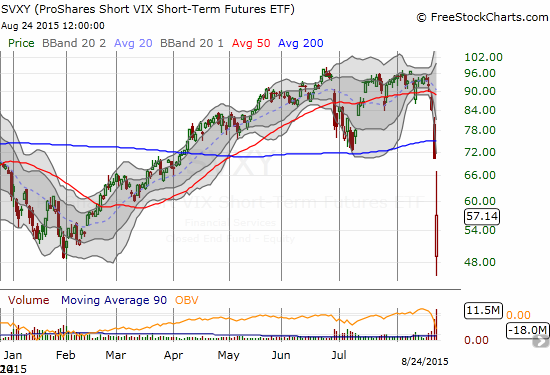
The impact on the volatility products, the ETFs, was equally dramatic. The ProShares Short VIX Short-Term Futures (SVXY) closed with a 18.8% loss and was down over 33% at one point.
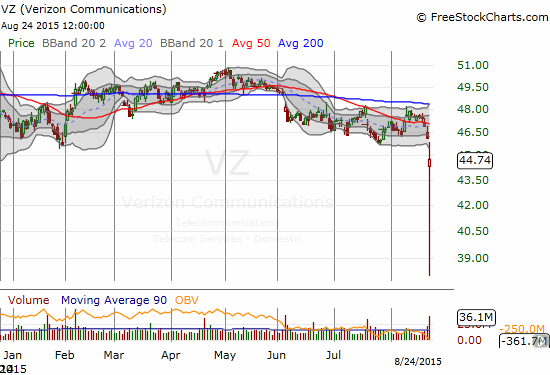
Before talking strategy, I am skipping to three individual stocks to demonstrate the unreal open that many stocks experienced. Verizon (VZ) was down as much as 17% after the open.
Apple (AAPL) put on one of the more spectacular shows on a day of spectacular shows. AAPL opened down a startling 10.0%. AAPL was down 13% at its low. Suddenly, AAPL became a steamroller in the opposite direction.
$AAPL back to flat. THAT is huge….
— Dr. Duru (@DrDuru) August 24, 2015
Suddenly, AAPL was up 2.9% at its high of the day before settling in for a 2.5% loss.
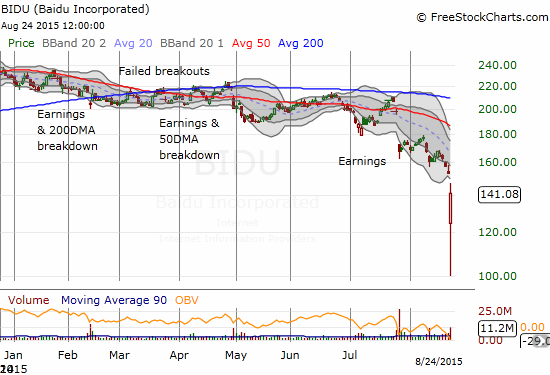
Baidu (BIDU) dropped to $100 and then gained FOURTY-ONE percent into the close!?!?!
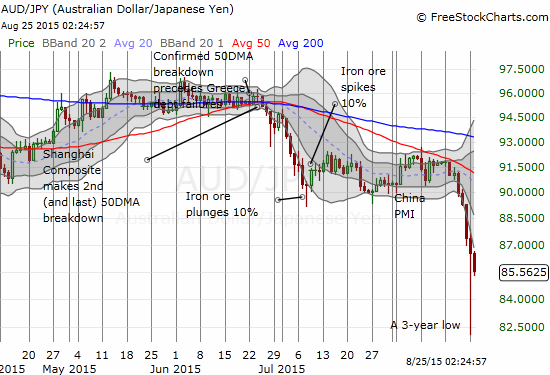
In case you were wondering, yes, the currency markets went absolutely bonkers starting from Sunday and all the way into the U.S. trading close. My favorite indicator of market sentiment, the Australian dollar (FXA) versus the Japanese yen (JPY), made things plain to me that panic was in full effect. It is very rare to see currencies move well past the Bollinger Bands. The sharp bounce back surprises me much less than the ability for AUD/JPY to drop as low as it did in the first place. This move could be an early warning shot on what I see as an increasing chance for a huge collapse in the Australian dollar.
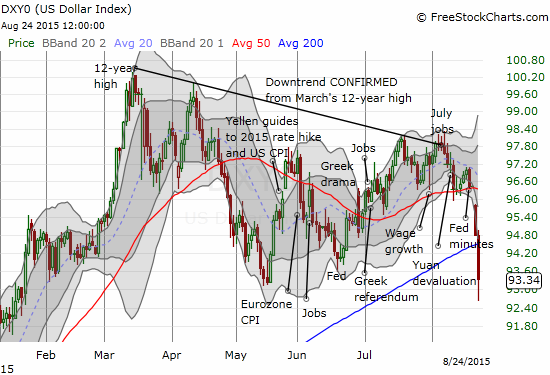
The U.S. dollar (UUP) continues to suffer as the market increasingly realizes the narrative of policy divergence is fading to black. I guess the stock market’s problem all along was NOT an overly strong dollar. Now the problem appears in the form of a weakening dollar.
All this trading chaos must have drivers, right. For those of you yearning for an explanation, I offer a bulleted summary of Jim Cramer’s sober analysis in “Cramer Remix: Waiting to buy? My message for you“:
- First of all, do not mistake the U.S. stock market action with the action in the U.S. economy.
- The Federal Reserve’s indecisiveness on interest rates is causing market nervousness and extra uncertainty.
- China has inflicted damage on the global economy – the Shanghai Composite should reverse its entire gain from 2200 to 5178 since “…it was built on tremendous account growth and loose requirements about borrowing on margin.”
- There is no systemic risk that could take the market down 25%, maybe there is another 6 or 7% down from here.
So that is a relatively bullish take.
I prefer master technician Tom McClellan’s outlook given what I see as continued deterioration in the underlying technicals of the market. Mclellan completely nailed this sell-off. I noted his well-timed warning last week. McClellan appeared on CNBC today dropping straight knowledge in the most deadpan, non-celebratory tone one could imagine. He even admonished CNBC on the definition of a correction like a stern schoolteacher (a correction is a market move contrary to the prevailing trend; a bull/bear market is defined by an up/downtrend). McClelland considers what’s coming a correction in an on-going bull market. Here are the famous technician’s most salient points:
- The VIX went way above its futures contracts. Whenever that happens, the market always bounces.
- The stock market correction has just begun and should run through April, 2016.
- The main tell is the eurodollar futures contract which is an interest rate contract. It predicts stock market action a year out (not perfectly!). The correction that happened is something McClelland has been looking for all year.
- The leading decline in the Dow Transports is similar to what happened in 1999.
- The biggest wildcard is the Federal Reserve. If the Fed comes in and provides fresh liquidity for the market, it will ruin his forecast. (This point was NOT included in the clip).
OK. So how to profit from all this? First and foremost, establish your trading rules and stick to them. Re-evaluate as needed but do NOT get swayed by the latest shift in the market, the loudest stampede, the biggest fears, or the loudest celebrations of a potential bottom. I of course recommend picking from the T2108 trading rules for trading the oversold period…
- With selling pressure so intense as represented by sky high volatility, by the ability of sellers to continue pressing well beyond lower Bollinger Bands, and by T2108 plunging to rock bottom lows at a record-setting pace, oversold buys must be made VERY strategically.
- Aggressive traders can buy when the VIX cracks a new high for this cycle. The longer you can wait, the better. There should be a bias for taking profits.
- Less aggressive traders can wait until AFTER the VIX closes below the previous day’s low. This approach could produce misses on key buying opportunities. Traders in this category should target holds until at least T2108 exits the oversold period. This occurs once T2108 closes at or above 20%.
- Conservative investors should wait until T2108 exits the oversold period to make a buy. This approach could cause more whiplash than the more aggressive strategies. I am also least inclined to follow this strategy as I believe the overall market is weakening at least through the seasonally weak months of August, September, and October. Exits from oversold periods may occur right below key resistance levels that could shift my preference to fades.
T2108 does not typically spend much time oversold. This is the huge opportunity for making aggressive buys during the oversold period, especially when the volatility index is soaring.
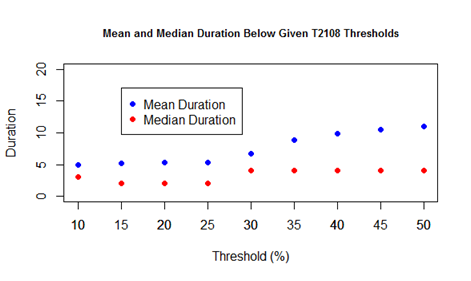
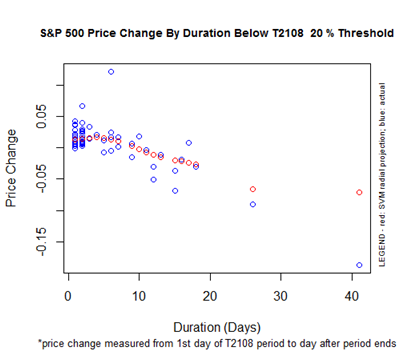
The longer T2108 stays in the oversold period, the more likely the S&P 500 (SPY) will exit lower than when it entered. So, once the oversold period reaches the mean of five days, traders need to start bracing themselves. I think the current dramatic plunge in T2108 means that we should brace for an extended stay in the oversold period.
Finally, here is a shortened summary of my trades as an example of the more aggressive approach to trading the oversold period.
The headlines in the early morning were full of global stock market carnage, and the U.S. futures were down significantly. I dusted off the rule book and got ready. Recall the 5-minute chart above on the S&P 500 and note that the action was moving fast. It was definitely a time I wish I had the trading bots on my side. At least I got the kind of trading day I love during oversold trading: initial selling to take stocks to over-extended lows followed by a rush of buying into the vacuum. At the open, my price alerts were firing like crazy, and I had to simply ignore them. They did not contain any new information that I needed. EVERYTHING was gapping down hard and deep. It was just a matter of selecting a few, focused targets and make the most of them. I also largely ignored the options I purchased on Friday. I knew they were dropping to zero, but my purchases already incorporated that scenario. The great advantage of buying options is never worrying about gaps against the position that instantly cause a loss larger than I was willing to take.
I met with a lot of frustration early on because market makers were not providing liquidity in the options market. This was understandable given the huge amount of selling at the open. It helped to solidify my resolve that this selling had to be bought. That is, market makers were likely anticipating a bounce and were slow to get proper pricing done. I created what limit orders I could on call options. Most of these orders in the likes of Disney (DIS) (see “Disney’s Bearish Breakdown: A Case Study of Risk Management for Long-Term Investors“), Apple (AAPL), Netflix (NFLX), and Canadian Solar (CSIQ) never filled. Google (GOOG) DID fill, and I was able to notch a quick double on that position. I quickly moved on to cover more short positions. I am now VERY naked and fought the urge all day to dabble in fresh put options and shorts. As a reminder, in the oversold period short positions get pared back significantly or closed out completely.
As I struggled to get options orders placed, it dawned on me that I should go after shares and plan to hold tight. Indeed, share purchases turned out to be my big winners on the day. I first doubled down on Friday’s “longer-term” purchases of ProShares Ultra S&P500 (SSO) and ProShares Short VIX Short-Term Futures (SVXY). At one point during the day’s rebound, I was sitting on a surprisingly good gain. I did not sell. In retrospect, I should have sold the SVXY position which had reached a 10% gain. It is not yet a standard play in the T2108 arsenal although I need to make it one. In this case, I could have preserved the SVXY-generated cash to fund future SSO positions. In shorter-term trading, I managed to flip SVXY TWICE in the midst of the volatility. The day turned out pretty well even as the close disappointed.
As I will continue to remind readers, I fully expect the oversold period to feel painful. Whatever I can do to buffer the pain, I will do. The quick flips and short-term trades help to provide the profits to do just that. This is also NOT a time for bears to chase stocks downward. That is asking for trouble. I think of stocks in the oversold period like rubber bands. They could snap upward at any time for any reason and quite abruptly. That kind of behavior is a recipe for quick losses on bearish positions. On the flip side, I am applying the T2108 trading rules to avoid random attempts at catching falling knives.
Finally, if you are not a currency trader, I highly recommend you at least make a habit of checking on the currency market. The wilder and more extreme things are in foreign exchange, the same you should expect for stocks….and the more you should expect an imminent reversal.
Daily T2108 vs the S&P 500
")
Black line: T2108 (measured on the right); Green line: S&P 500 (for comparative purposes)
Red line: T2108 Overbought (70%); Blue line: T2108 Oversold (20%)
Weekly T2108

*All charts created using freestockcharts.com unless otherwise stated
The charts above are the my LATEST updates independent of the date of this given T2108 post. For my latest T2108 post click here.
Related links:
The T2108 Resource Page
Expanded daily chart of T2108 versus the S&P 500
Expanded weekly chart of T2108
Be careful out there!
Full disclosure: long AAPL calls and put spread, long SSO call options and shares, long UVXY put options, long SVXY shares, short AUD/JPY, net long the U.S. dollar