
(T2108 measures the percentage of stocks trading above their respective 40-day moving averages [DMAs]. It helps to identify extremes in market sentiment that are likely to reverse. To learn more about it, see my T2108 Resource Page. You can follow real-time T2108 commentary on twitter using the #T2108 hashtag. T2108-related trades and other trades are occasionally posted on twitter using the #120trade hashtag. T2107 measures the percentage of stocks trading above their respective 200DMAs)
T2108 Status: 28.0%
T2107 Status: 34.8% (a 9-month low!)
VIX Status: 13.7 (8.7% gain)
General (Short-term) Trading Call: Neutral
Active T2108 periods: Day #190 over 20% (overperiod), Day #1 under 30%, Day #5 under 40%, Day #45 under 50%, Day #62 under 60%, Day #261 under 70%
Reference Charts (click for view of last 6 months from Stockcharts.com):
S&P 500 or SPY
SDS (ProShares UltraShort S&P500)
U.S. Dollar Index (volatility index)
EEM (iShares MSCI Emerging Markets)
VIX (volatility index)
VXX (iPath S&P 500 VIX Short-Term Futures ETN)
EWG (iShares MSCI Germany Index Fund)
CAT (Caterpillar).
Commentary
The market continues to follow through on the bearish divergence I pointed out at the beginning of last week. The lags have finally caught up with the S&P 500 (SPY) with a clean breakdown from its 50-day moving average (DMA) on Friday.
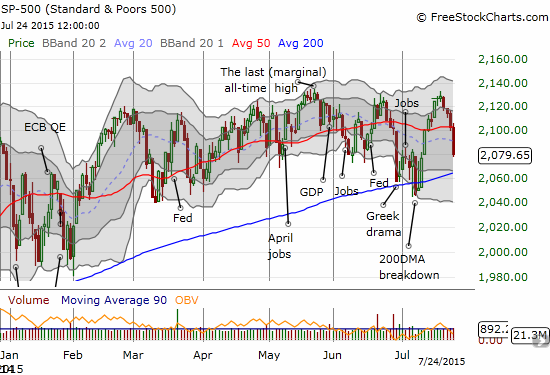
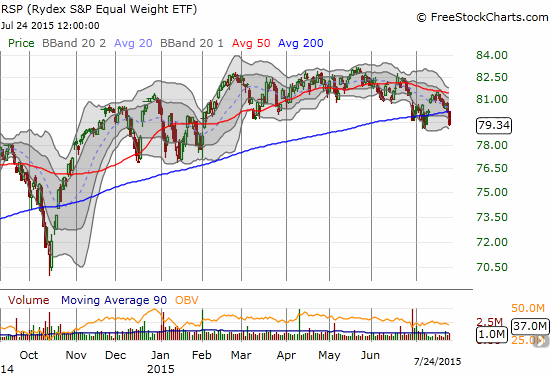
The S&P 500 already appears headed for another retest of its 200DMA. I did not expect a return of selling pressure so soon. The Guggenheim S&P 500 Equal Weight ETF (RSP) is further emphasizing the bearish developments. RSP has already broken down below its 200DMA and seems very likely to break the low from early this month. Such a development would confirm a BEARISH downtrend from the recent highs for RSP.
The “good news” is that the next 200DMA retest for the S&P 500 SHOULD come with true oversold conditions: T2108 below 20%. If so, I will feel more comfortable getting aggressive on the next cycle of buying; that is, not just fading volatility but also buying call options on ProShares Ultra S&P500 (SSO). The increasingly bearish action on RSP will likely make me even quicker to take profits than in the last cycle.
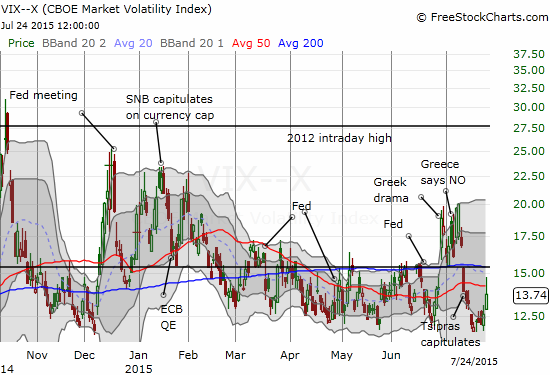
T2108 closed at 28%. Below 30%, T2108 becomes “close enough” to oversold to trigger related trades. However, I held my fire given I think the S&P 500 still has a 200DMA retest in its near future. Moreover, the volatility index (the VIX) is still below the 15.35 pivot and has yet to spike with a force anywhere close to what we just saw earlier this month. I was primed to start fading volatility on a retest of the pivot point but of course my orders never filled.
Another ominous sign comes from T2107, the percentage of stocks trading above their 200DMAs. Like RSP, it is officially leading the market lower as it reveals the true weakness underneath the hood. At 34.8%, T2107 closed at levels last seen in October of last year when T2108 was finally bouncing out of true oversold conditions.
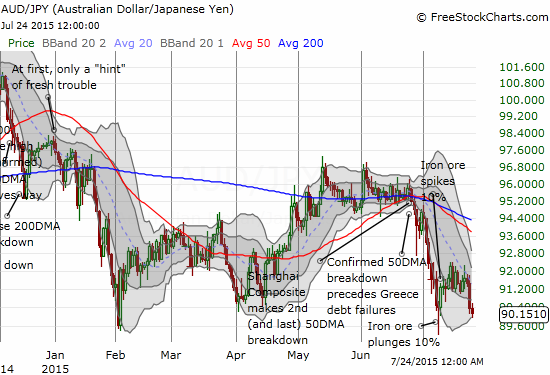
And if THAT is not enough to cause concern, the Australian dollar (FXA) versus the Japanese yen (FXY) is confirming ALL of this weakness with a fresh tug downward. If it breaks the intraday low from July 8th, then I will have to take a pause no matter where T2108 is trading and re-evaluate my trading strategy.
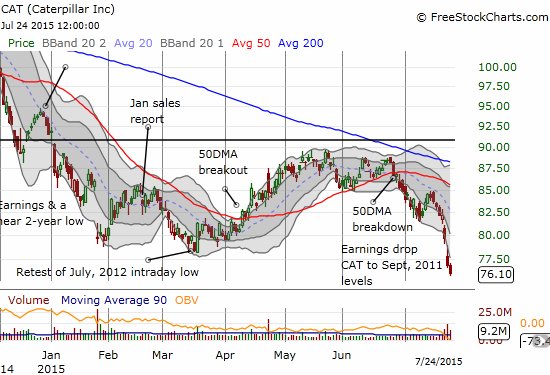
I sold my Caterpillar (CAT) puts just ahead of earnings.
Sold (closed) $CAT puts. Rapid plunge pushing beyond lower-Bollinger Band as test of 2012 lows in play. #120trade
— Duru A (@DrDuru) Jul. 22 at 06:50 AM
Earnings turned out to be particularly brutal for CAT. The intense selling pressure persisted right into Friday’s close. The stock is now trading at levels last seen in September, 2011. The collapse in commodities has truly accelerated. Readers may have recognized an increasing number of commodity-related posts as I am scrambling to apply trades against my Commodities Crash Playbook and make sure I do not miss the opportunities that abound right now (on the long AND short side!).
Perhaps the biggest exclamation mark from Friday came from Amazon.com (AMZN). The stock was a darling as it gapped up an amazing 20%. However, sellers immediately went to work and by the close, AMZN lost half its percentage gain. It was a Google (GOOG) style eruption that ended in a bit of a whimper.
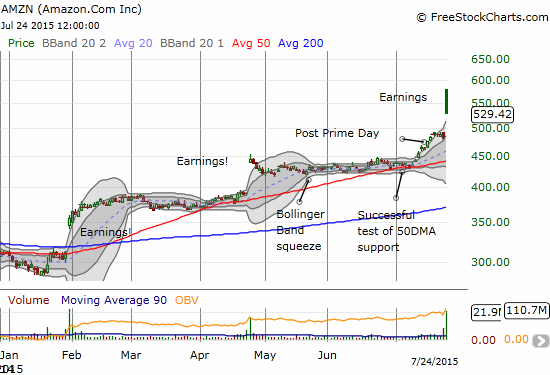
Although AMZN was an easy target or fading because it was sooooo far above its upper-Bollinger Band (BB), I was actually focused on buying opportunities. AMZN TENDS to do well off its post-earnings open, but I adjusted my post-earnings approach to looking for buyable intraday pullbacks. The first one worked so well that I plowed the profits (and more) right back into another attempt later in the day. The second time was NOT a charm.
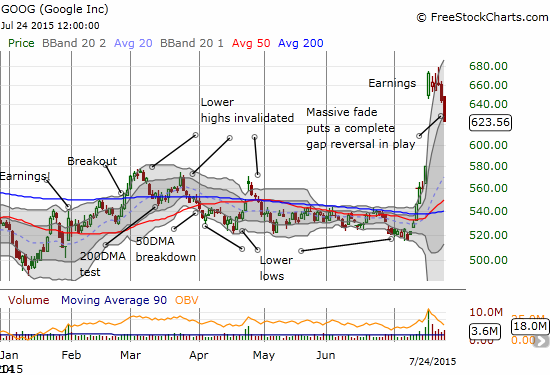
Speaking of Google (GOOG), the stock is officially in reversal mode as it has begun to fill its post-earnings gap up. The inability for buyers to keep up the enthusiasm for these immense post-earnings moves is itself a bearish warning. I will be looking for these stocks to at least stabilize in the coming week; otherwise, the stock market could be in for a lot more trouble.
Oh – and did I mention the U.S. Federal Reserve has another meeting and monetary decision this week? If the VIX spikes further ahead of the release of a decision on the 29th, I will make sure to at least start a fade on the VIX.
Yes – there are a LOT o important signals to monitor this week!
Daily T2108 vs the S&P 500
")
Black line: T2108 (measured on the right); Green line: S&P 500 (for comparative purposes)
Red line: T2108 Overbought (70%); Blue line: T2108 Oversold (20%)
Weekly T2108

*All charts created using freestockcharts.com unless otherwise stated
The charts above are the my LATEST updates independent of the date of this given T2108 post. For my latest T2108 post click here.
Related links:
The T2108 Resource Page
Expanded daily chart of T2108 versus the S&P 500
Expanded weekly chart of T2108
Be careful out there!
Full disclosure: short AUD/JPY, long AMZN call options