
(T2108 measures the percentage of stocks trading above their respective 40-day moving averages [DMAs]. It helps to identify extremes in market sentiment that are likely to reverse. To learn more about it, see my T2108 Resource Page. You can follow real-time T2108 commentary on twitter using the #T2108 hashtag. T2108-related trades and other trades are occasionally posted on twitter using the #120trade hashtag. T2107 measures the percentage of stocks trading above their respective 200DMAs)
T2108 Status: 56.9%
T2107 Status: 56.0%
VIX Status: 13.4
General (Short-term) Trading Call: Neutral.
Active T2108 periods: Day #132 over 20%, Day #91 above 30%, Day #35 above 40%, Day #19 over 50% (overperiod), Day #1 under 60% (underperiod), Day #201 under 70%
Reference Charts (click for view of last 6 months from Stockcharts.com):
S&P 500 or SPY
SDS (ProShares UltraShort S&P500)
U.S. Dollar Index (volatility index)
EEM (iShares MSCI Emerging Markets)
VIX (volatility index)
VXX (iPath S&P 500 VIX Short-Term Futures ETN)
EWG (iShares MSCI Germany Index Fund)
CAT (Caterpillar).
Commentary
The Federal Reserve issued its latest judgement on monetary policy and the economy, and it resolved very little. Volatility did manage to increase post-Fed, but it was not meaningful relative to my flyer trade on ProShares Ultra VIX Short-Term Futures (UVXY) call options.
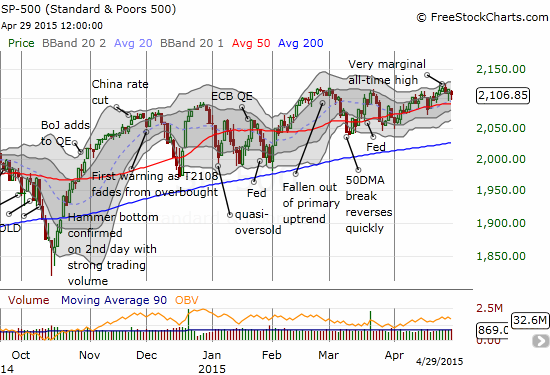
T2108 dipped below 60% again as the S&P 500 (SPY) dropped fractionally. Even with the 50DMA continuing its ever so subtle uptrend, the S&P 500 remains effectively trapped within a chopfest. The Fed was not able to release any pent-up energy to the upside or downside.
The biggest headline for me is the end of the U.S. dollar’s (DXY0) primary uptrend. Today marked convincing follow-through on the breakdown.
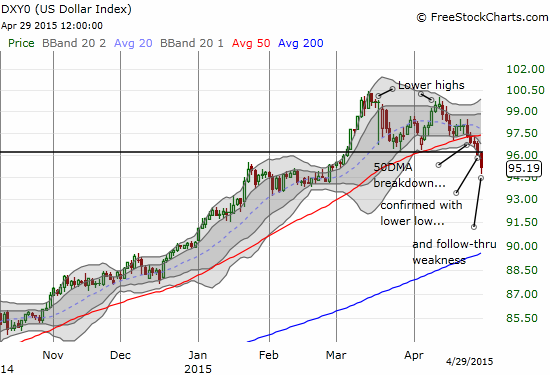
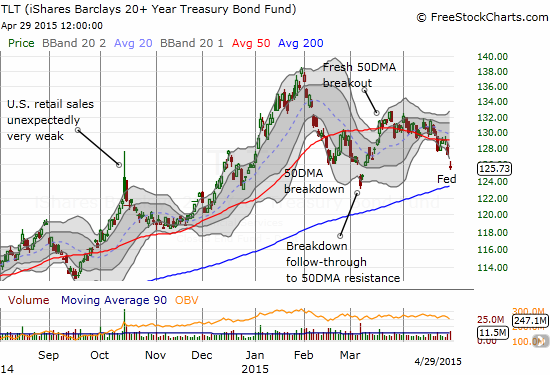
This is happening at the same time yields are increasing again. The combination of dollar weakness and higher yields could suggest a marginal reversal in the attractiveness of the U.S. to foreign investors and traders.
I am honestly not ready to jump off the dollar bull bandwagon. Yet, the technicals force me to do so. As I stated in my last fundamentally-driven article, I practiced the new discipline by cleaning out all my forex positions the night before the Federal Reserve meeting – and thank goodness! I expect this breakdown to cause a lot of ripple effects that should increase volatility in currency markets until traders get used to a new paradigm.
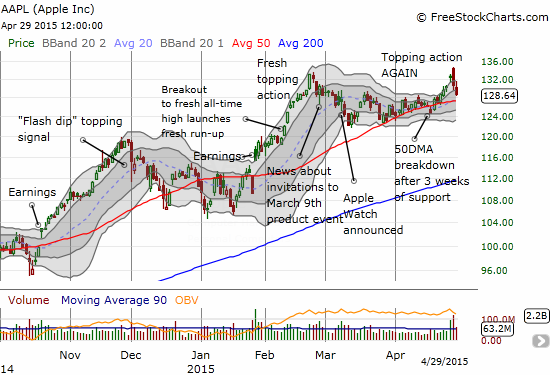
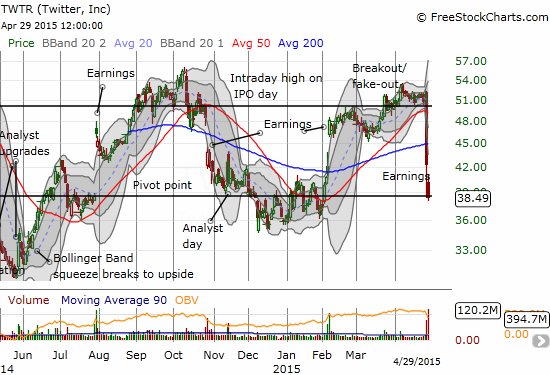
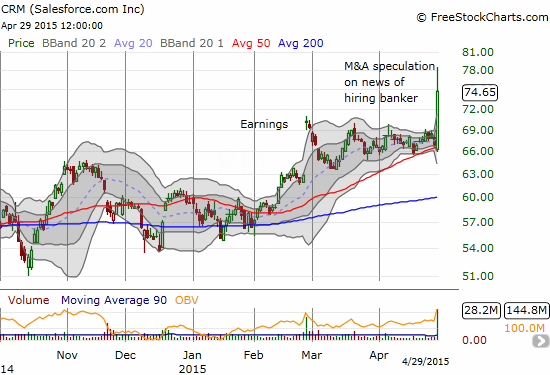
Moving on quickly to individual stocks, I have several charts of interest. Commentary is included at the bottom of the charts…
Daily T2108 vs the S&P 500
")
Black line: T2108 (measured on the right); Green line: S&P 500 (for comparative purposes)
Red line: T2108 Overbought (70%); Blue line: T2108 Oversold (20%)
Weekly T2108

*All charts created using freestockcharts.com unless otherwise stated
The T2108 Resource Page
Expanded daily chart of T2108 versus the S&P 500
Expanded weekly chart of T2108
Be careful out there!
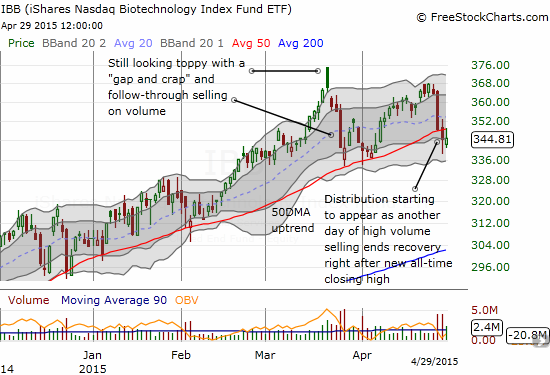
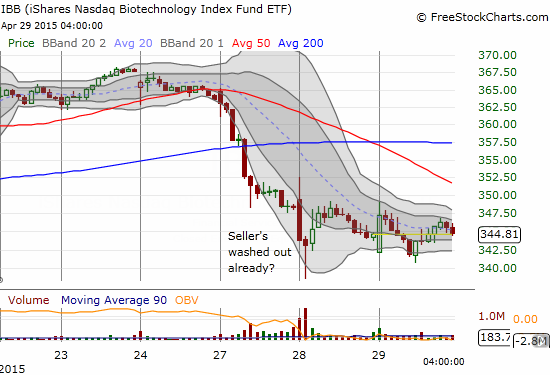
Full disclosure: long UVXY call options, long TLT call options, long IBB put options