
(T2108 measures the percentage of stocks trading above their respective 40-day moving averages [DMAs]. It helps to identify extremes in market sentiment that are likely to reverse. To learn more about it, see my T2108 Resource Page. You can follow real-time T2108 commentary on twitter using the #T2108 hashtag. T2108-related trades and other trades are occasionally posted on twitter using the #120trade hashtag. T2107 measures the percentage of stocks trading above their respective 200DMAs)
T2108 Status: 58.9%
T2107 Status: 55.9%
VIX Status: 13.1
General (Short-term) Trading Call: Neutral. Quick drop from all-time highs keeps me assuming market remains in a chopfest.
Active T2108 periods: Day #130 over 20%, Day #89 above 30%, Day #33 above 40%, Day #17 over 50% (overperiod), Day #1 under 60% (underperiod), Day #199 under 70%
Reference Charts (click for view of last 6 months from Stockcharts.com):
S&P 500 or SPY
SDS (ProShares UltraShort S&P500)
U.S. Dollar Index (volatility index)
EEM (iShares MSCI Emerging Markets)
VIX (volatility index)
VXX (iPath S&P 500 VIX Short-Term Futures ETN)
EWG (iShares MSCI Germany Index Fund)
CAT (Caterpillar).
Commentary
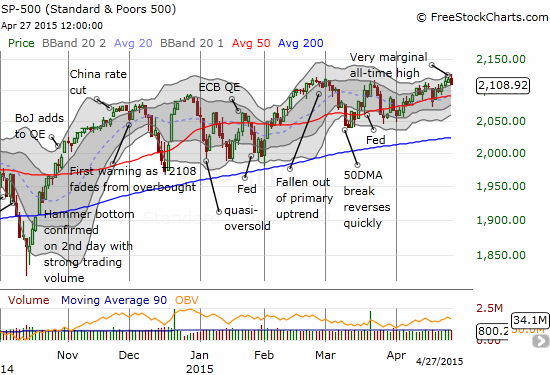
On Friday, the S&P 500 (SPY) made a very marginal new all-time high. T2108 failed to cooperate and instead pulled back marginally. Today, Monday, April 27th, marked mild follow-through on that bearish divergence. The S&P 500 pulled back a mere -0.4% but T2108 tumbled all the way below 60%. Once again, overbought conditions are proving elusive on this 199th day straight without T2108 trading into overbought territory! (And now we are going for an extended period without oversold conditions too). The chopfest essentially continues even with the very subtle upward “tilt” to the index.
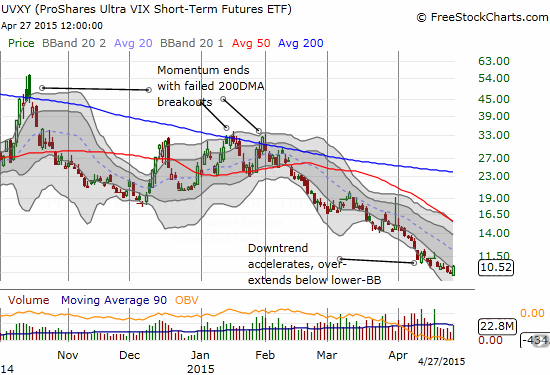
The Federal Reserve is coming up on Wednesday, but I find myself unable to pull the trigger on my typical “fade volatility” pre-Fed trade. Volatility in the form of the VIX is generally trending down into this meeting. The Fed has done such a great job in calming the markets and sending volatility lower that I am left wondering how in the world could it pull off the trick again at these levels. So this time around I took a bit of a flyer and doubled down on my “just in case” ProShares Ultra VIX Short-Term Futures (UVXY) call options.
The fascinating part of this return to low volatility is that central banks continue trying, in great vain, to warn financial markets of growing risks in the current complacency and on-going reach for yield (the latest example was again from the Reserve Bank of Australia). But of course markets can hardly take time to listen to the warnings because they follow what the central banks DO. And what they continue to do is reassure markets with their actions and policies.
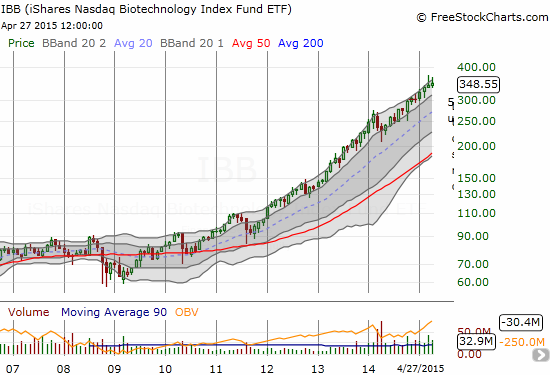
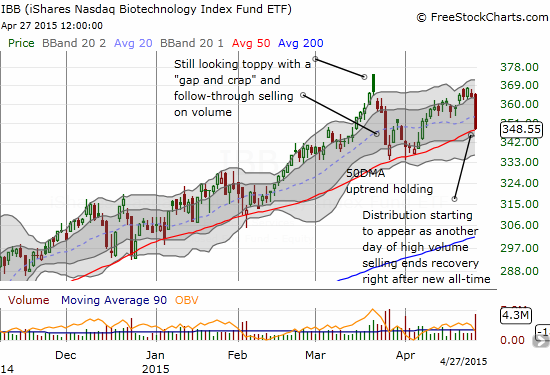
Anyway, I mainly wrote tonight to call your attention to an uptrend that is in grave danger from some notable topping action and distribution. Distribution occurs when a stock/ETF fails to make progress while at the same time selling volume greatly outpaces buying volume. This is exactly what is unfolding for iShares Nasdaq Biotechnology (IBB). IBB has been a market darling providing tremendous returns despite the tremendous risk embedded in many of its individual components. The monthly chart below shows the relentless nature of the uptrend. The daily chart shows the technical damage happening in the short-term. All eyes should now be watching to see whether the uptrend support can hold yet again. If not, look out…
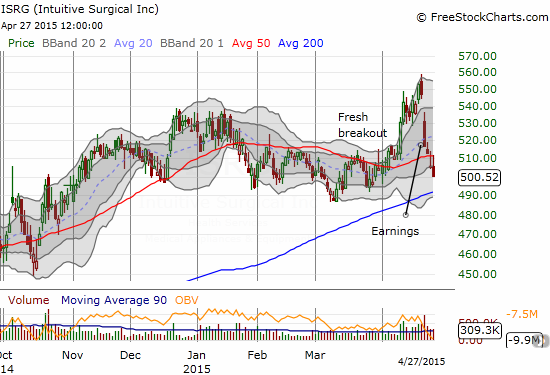
Oh, and speaking of the medical-related stocks, Intuitive Surgical (ISRG) failed to maintain its pre-earnings bullish posture. The selling has yet to end post-earnings.
Daily T2108 vs the S&P 500
")
Black line: T2108 (measured on the right); Green line: S&P 500 (for comparative purposes)
Red line: T2108 Overbought (70%); Blue line: T2108 Oversold (20%)
Weekly T2108

*All charts created using freestockcharts.com unless otherwise stated
The T2108 Resource Page
Expanded daily chart of T2108 versus the S&P 500
Expanded weekly chart of T2108
Be careful out there!
Full disclosure: long UVXY call options