(T2108 measures the percentage of stocks trading above their respective 40-day moving averages [DMAs]. It helps to identify extremes in market sentiment that are likely to reverse. To learn more about it, see my T2108 Resource Page. You can follow real-time T2108 commentary on twitter using the #T2108 hashtag. T2108-related trades and other trades are occasionally posted on twitter using the #120trade hashtag. T2107 measures the percentage of stocks trading above their respective 200DMAs)
T2108 Status: 51.3%
T2107 Status: 52.9%
VIX Status: 13.9
General (Short-term) Trading Call: Neutral. Market still seems stuck in a chopfest. T2107 backs off its breakout. T2108’s close call with overbought conditions produces a slight overall bearish bias.
Active T2108 periods: Day #124 over 20%, Day #83 above 30%, Day #27 above 40%, Day #11 over 50% (overperiod), Day #1 under 60% (underperiod), Day #193 under 70%
Reference Charts (click for view of last 6 months from Stockcharts.com):
S&P 500 or SPY
SDS (ProShares UltraShort S&P500)
U.S. Dollar Index (volatility index)
EEM (iShares MSCI Emerging Markets)
VIX (volatility index)
VXX (iPath S&P 500 VIX Short-Term Futures ETN)
EWG (iShares MSCI Germany Index Fund)
CAT (Caterpillar).
Commentary
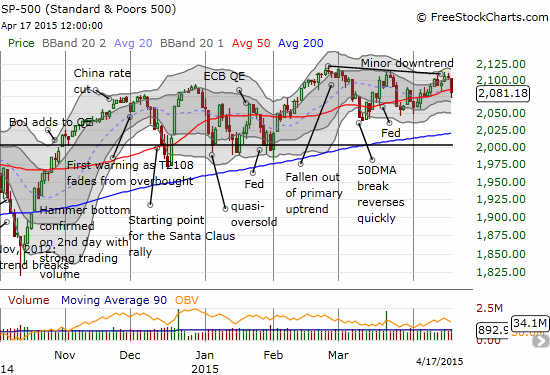
It was another week of chop for the S&P 500 (SPY) as earnings season kicked off. Little was accomplished again, but there were several developments of note.
First, T2108 had another close call with overbought conditions. On Wednesday, April 15, tax day in the U.S., T2108 rose as high as 67.8% before fading to a 64.9% close. That turned out to be the peak before the fade as T2108 finished the week at 51.3% with a one-day drop over 10 percentage points.
Accordingly, the S&P 500 (SPY) dropped to end the week below the 50DMA yet again. This important trendline continues to trudge upward, but it is VERY hard to feel a sense of progress in this chop! Despite this trendline, the fade from overbought conditions must be considered a bearish development until proven otherwise.
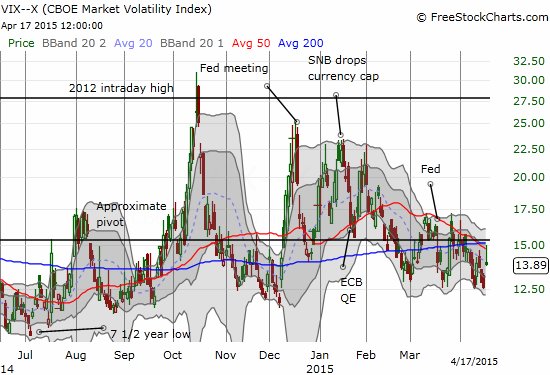
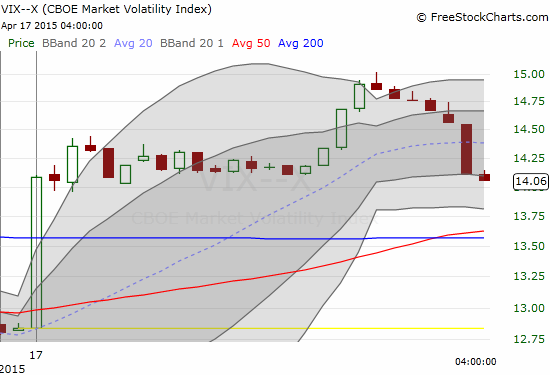
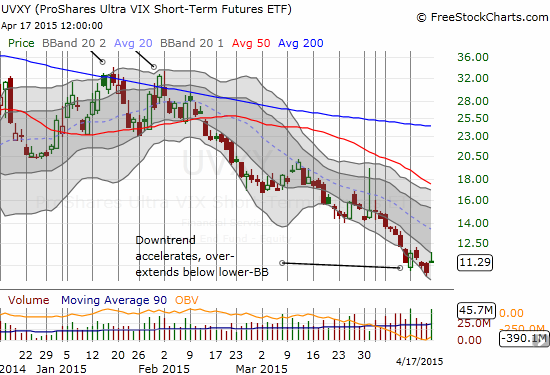
The week started with a great trade on volatility. The week would have ended with a similarly great trade but I was waiting for another over-extension of contentment by the market. The market failed to follow through on Monday’s small awakening in volatility. Friday’s move higher lasted 60 minutes, flattened out for another three hours, and suddenly came to life again for nearly 60 minutes. The final 90 minutes reversed that last outburst. The end result was a strong fade in volatility just under the pivot and a close almost exactly where the volatility index, the VIX, closed on Monday.
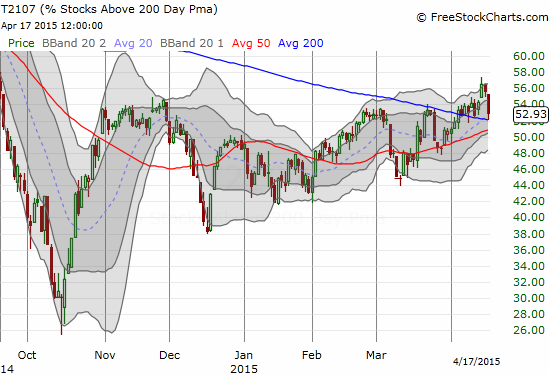
The other big move for the week was on T2107, the percentage of stocks trading above their respective 200DMAs. T2107 broke out two weeks ago and slowly trended up from there. Friday’s close brought T2107 back to the breakout point. Lower levels from here should confirm the slight bearish bias on the trading call.
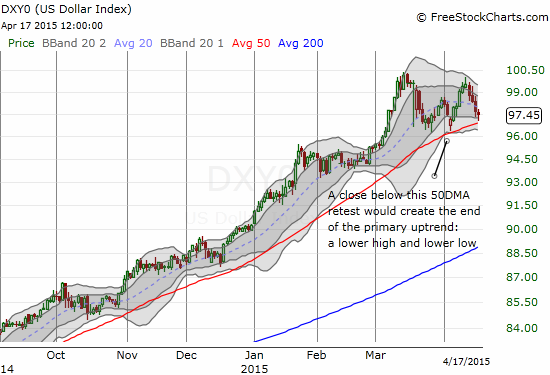
The closely watched dollar index (DXY0) ended the week flirting once again with 50DMA support. The dollar has finally lost its upward momentum but the uptrend is not yet over. All traders should be watching dollar developments closely. A break below last week’s low would create a 50DMA breakdown and end the primary uptrend. Such an event could cause cascading events including surging commodities, especially oil, and a surging stock market.
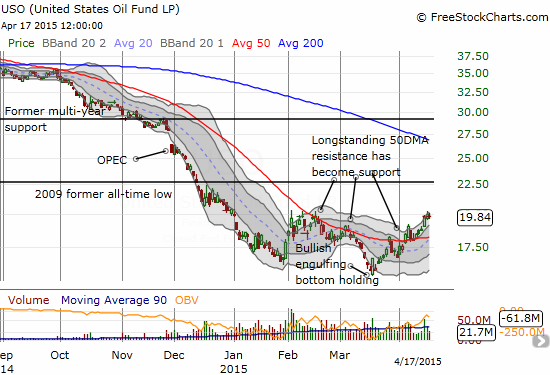
Speaking of oil, 50DMA support continues to hold quite well for the United States Oil ETF (USO). An uptrend channel is now developing between the upper-Bollinger Bands (BBs). I am currently betting on another 50DMA retest sooner than later…which in effect is a bet that the U.S. dollar is going to bounce soon and convincingly.
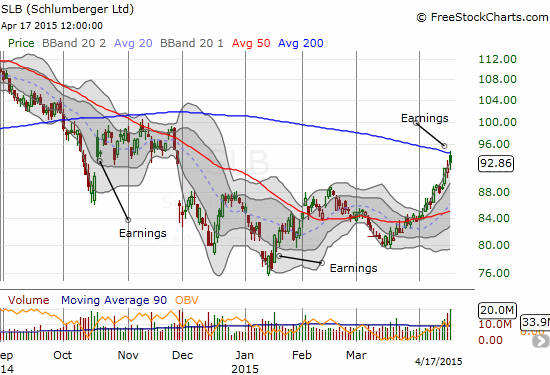
Schlumberger Limited (SLB), “the world’s largest oil field services company” reported results this week that included an announcement of massive layoffs. The market loved it and sent SLB into a critical test of 200DMA overhead resistance.
In late November, I argued for what I thought was a pretty good hedged bet in the oil patch in the wake of the Halliburton Company (HAL) dealing for Baker Hughes Incorporated (BHI). I thought April expirations would be long enough to let the bearish or the bullish case fully play out. Instead, what I got was a LOT of churn and a late rally that came just in the nick of time to let me salvage about half of the HAL position!
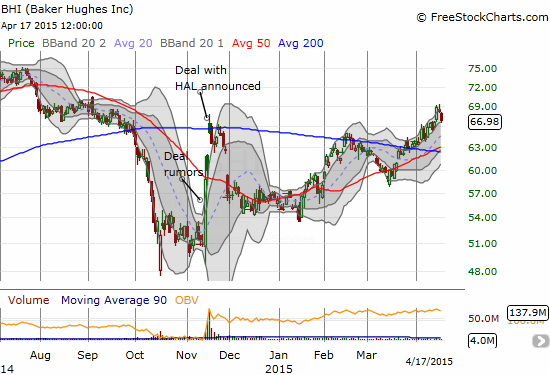
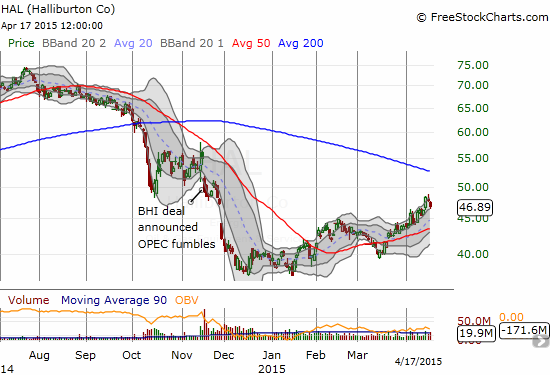
Seeing this divergence in performance makes me think a new hedge – long HAL and short BHI – makes sense. Or could it be the market expects another BHI suitor willing to pay even more dearly than HAL?
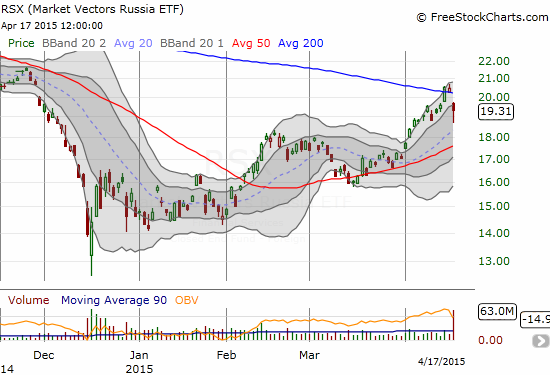
Russia has apparently benefited from the bottoming in oil in the past month or so. It has followed oil higher from the March lows. Now Market Vectors Russia ETF (RSX) is struggling to punch through 200DMA resistance. I was a little early on two sides of a Russia trade. On April 10, RSX dipped, and I bailed on a position in Direxion Daily Russia Bull 3X ETF (RUSL) for a loss. I then promptly switched to Direxion Daily Russia Bear 3X ETF (RUSS) thinking RSX was starting a fresh extended sell-off. Instead, the trend continued until the massive sell-off on Friday. Timing is everything! I am holding onto RUSS unless RSX beats out 200DMA resistance. I am again counting on the U.S. dollar to bounce and/or oil to reverse.
Now I leave the oil-patch for the internet.
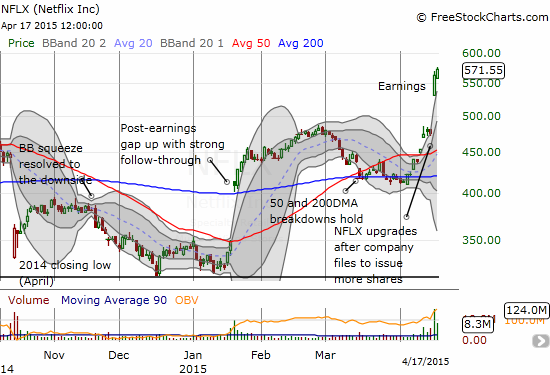
Netflix (NFLX) is of course the name for the week. My refusal to take profits on my pre-earnings fade when I had them proved costly. That position never got better than breakeven shortly thereafter. I did decide to hold through earnings simply out of disbelief that the huge consensus and rush of analysts to upgrade NFLX ahead of earnings could be correct. The chart below says all that needs to be said about how the herd absolutely nailed this one in a rare display of high expectations from the mass consensus playing out exactly according to script. Not only did NFLX fly well above its upper-Bollinger Band (BB), the stock pressed forward a second day after that. You simply cannot get more bullish than this. Also in NFLX’s favor is a plan to split the stock to “make it more accessible.” This whole thing is a wonder to behold and not to be forgotten given how rare it is to see such a combination.
One analyst got so enamored with the momentum that he issued a $900 price target! (See “Netflix shares are exploding higher and one analyst has a stunning new prediction for the stock“). This is a rare case where I actually fully agree with stubbornly bearish Doug Kass:
There is ZERO value in FBR Capital's upgrade in the price target at $NFLX from $400 to $900. None, zero, nada
— Douglas Kass (@DougKass) April 16, 2015
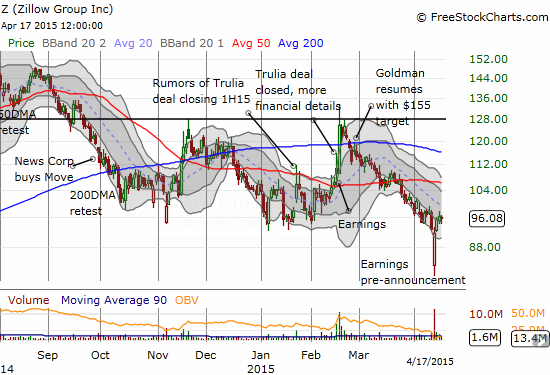
Zillow (Z) completely collapsed after an earnings pre-announcement. However, in classic manic form, the stock came roaring back and is essentially trading where it was at the open BEFORE the pre-announcement. My earlier skepticism on Zillow and its deal with Trulia played out to a tee, but I did not profit from it as much as I should have. I closed out my latest put options into the selling last week, but I was also holding shares as part of a hedged bet. I refreshed the hedge after Zillow’s comeback. I now suspect that last week’s collapse represents a complete washout of sellers.
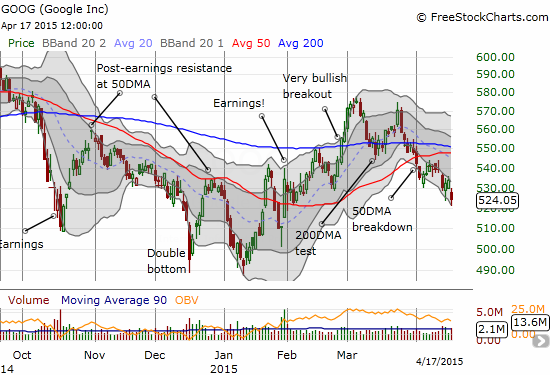
Google (GOOG) has quickly transformed itself from a bullish to a bearish position. I guess the anti-trust action from the European Union (EU) is really throwing the company for a loop. The 50DMA breakdown that started the month has led to continued selling down a neat channel formed by the lower-BBs.
Moving on to the industrial economy…
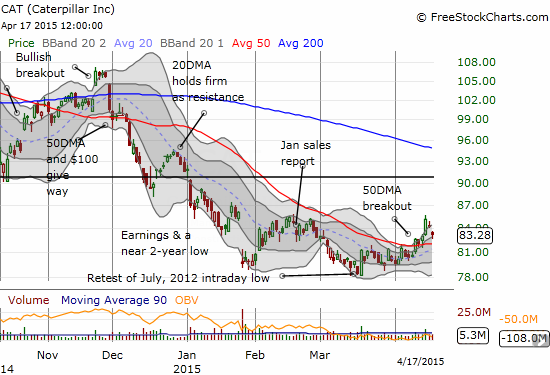
Both Caterpillar (CAT) and General Electric (GE) faded recent breakouts. In the case of CAT, I was fully prepared and loaded up on a fresh put spread. The surge on Wednesday, April 15, looked on the surface like a powerful follow-through to a 50DMA breakout. Friday’s gap down completed the reversal.
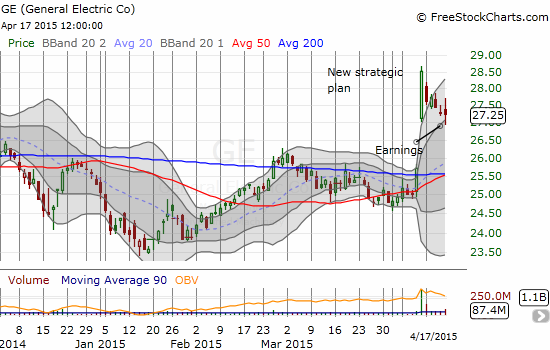
General Electric (GE) pleased the market with a plan to complete its return to its industrial roots. GE will shed its financial unit and use the proceeds to gorge on its own stock and shower investors with dividends (make it rain GE!). This is a natural follow-up to a strategy outlined in 2014. The market loved it. However, the classic cool-off from an extended move beyond the BBs went into effect. By Friday, the incremental enthusiasm from last Friday’s surge had fully dissipated. The last two days produced doji’s that represent buy/sell indecision. I think a trade here makes a lot of sense with a tight stop below the lows from Friday. GE should be good to at least get back to $28.50 or so. If the lows break, look out below for a potential gap fill.
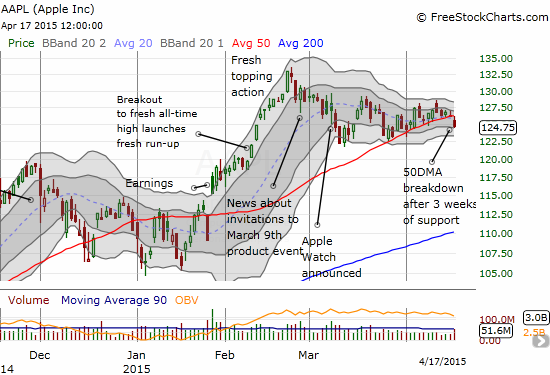
Finally, what’s a chartfest without Apple (AAPL)? This was a week where AAPL’s behavior was closer to expectations with 2 of 5 days featuring follow-through to the opening momentum. Friday’s move was the most significant as 50DMA support finally broke down on high volume. This is of course an ominous move ahead of earnings on April 27th and the official release of the Apple Watch, but I will not over-state the case. Let’s see whether the next trading week brings follow-through selling or just more churn within the current range.
Daily T2108 vs the S&P 500

Black line: T2108 (measured on the right); Green line: S&P 500 (for comparative purposes)
Red line: T2108 Overbought (70%); Blue line: T2108 Oversold (20%)
Weekly T2108

*All charts created using freestockcharts.com unless otherwise stated
The T2108 Resource Page
Expanded daily chart of T2108 versus the S&P 500
Expanded weekly chart of T2108
Be careful out there!
Full disclosure: long USO put options, net long the U.S. dollar, long RUSS, long Z shares and puts, long RUSS, long CAT put spread
