
(T2108 measures the percentage of stocks trading above their respective 40-day moving averages [DMAs]. It helps to identify extremes in market sentiment that are likely to reverse. To learn more about it, see my T2108 Resource Page. You can follow real-time T2108 commentary on twitter using the #T2108 hashtag. T2108-related trades and other trades are occasionally posted on twitter using the #120trade hashtag. T2107 measures the percentage of stocks trading above their respective 200DMAs)
T2108 Status: 57.0%
T2107 Status: 52.8%
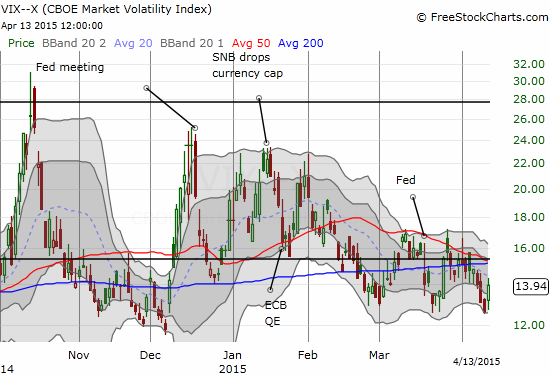
VIX Status: 13.9
General (Short-term) Trading Call: Neutral. Market still seems stuck in a chopfest. T2107 is still showing the potential for an important breakout.
Active T2108 periods: Day #120 over 20%, Day #79 above 30%, Day #23 above 40%, Day #7 over 50% (overperiod), Day #1 under 60% (underperiod), Day #189 under 70%
Reference Charts (click for view of last 6 months from Stockcharts.com):
S&P 500 or SPY
SDS (ProShares UltraShort S&P500)
U.S. Dollar Index (volatility index)
EEM (iShares MSCI Emerging Markets)
VIX (volatility index)
VXX (iPath S&P 500 VIX Short-Term Futures ETN)
EWG (iShares MSCI Germany Index Fund)
CAT (Caterpillar).
Commentary
Volatility looks well over-extended to the downside, especially just ahead of earnings season. #VIX $VXX $UVXY
— Dr. Duru (@DrDuru) April 13, 2015
I tweeted my comments on volatility (through StockTwits) soon after the market open. I was looking at ProShares Ultra VIX Short-Term Futures (UVXY). UVXY was stretching below its lower-Bollinger Band (BB), but I did not know that the volatility index would gap up before declining toward Friday’s low. My data source (FreeStockCharts.com) has a 20-minute delay on the VIX. So, I just assumed the VIX was getting just as over-stretched as UVXY. This was a VERY interesting case of a divergence that quickly corrected.
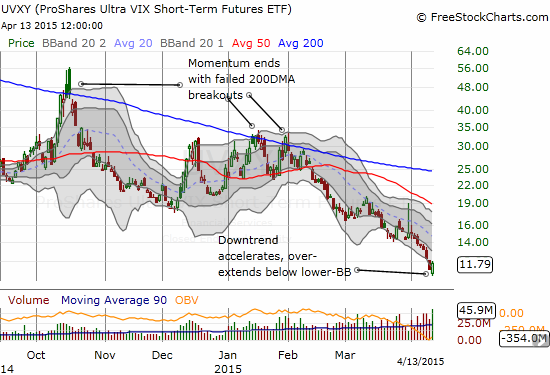
Regular readers can easily guess what I tried after this tweet: I loaded up on UVXY call options. The trade turned into what will likely be my best trade for the entire week. I sold the position after it doubled late into the trading session.
This awakening of volatility out of its stupor is not as surprising as the stupor itself just ahead of earnings. I discussed my surprise in the last T2108 Update, so I was mentally ready to pounce on a contrarian trade. The rise in volatility occurred just as the S&P 500 stopped short at a minor downtrend line.
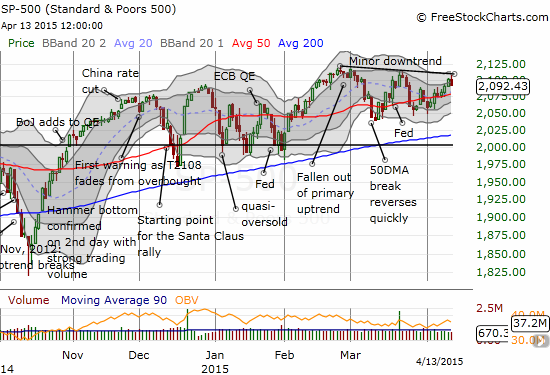
This decline was enough to send T2108 back under 60%. I am once again standing down from expectantly waiting for overbought conditions (at or above 70%).
During the day I took note of two interesting charts. I post these with the standard caveat that earnings news usually trumps technicals.
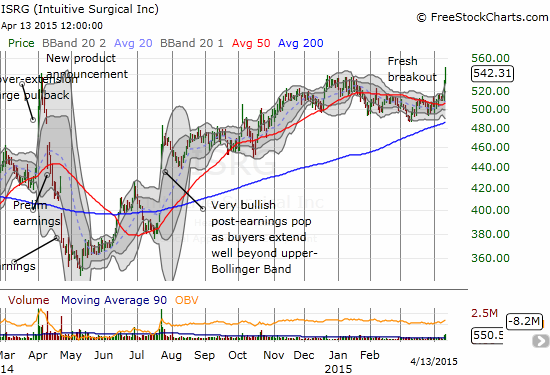
Intuitive Surgical (ISRG)
Timing is everything. I have been waiting and waiting for a good re-entry for ISRG. In fact, it has been too long since I was last in this stock. Well, on Friday, ISRG tripped a price alert with a strong buying surge. I could not get around to making a trade. Today, ISRG demonstrated convincing follow through with more buying on high volume. The stock faded a bit from its intraday high but it still closed at a 52-week high. Earnings are on April 21st. I could not find any news to explain the move.
ISRG closed for a second day above its upper-Bollinger Band (BB). A typical pattern on a sustained extension beyond the BB is for latecomers to add one more day of follow-through before some kind of reversal or consolidation. I was of course trying to get into ISRG before such a surge got rolling.
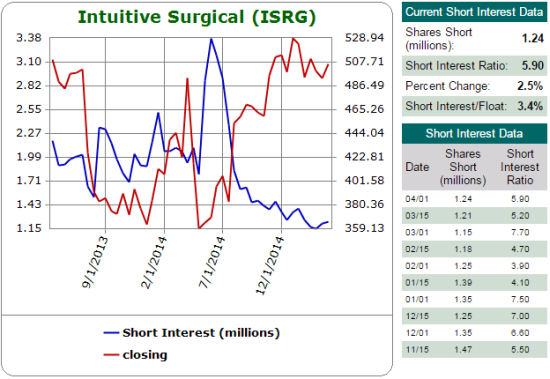
Source: Schaeffer’s Investment Research
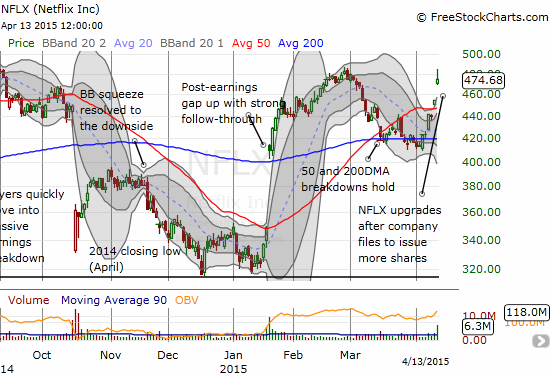
Netflix (NFLX)
Netflix (NFLX) has also surged toward its 52-week high (which is also an all-time high).
After hours on Friday, the company released its proxy statement. It included a request to shareholders for approval of the issuance of a tidal wave of stock:
“To amend our Certificate of Incorporation to increase the number of shares of capital stock we have authorized to issue from 170,000,000 (160,000,000 shares of common stock and 10,000,000 shares of preferred stock), par value $0.001, to 5,000,000,000 (4,990,000,000 shares of common stock and 10,000,000 shares of preferred stock), par value $0.001;”
The market being what it is, responded very favorably to the news, egged on by big analyst upgrades in the morning. Benzinga noted five bullish analyst calls going into earnings on Wednesday evening. Perhaps most important was the 180 degree turn by UBS to jump off the bear truck to the bull train. UBS delivered an upgrade from neutral to buy and a revised price target from $370 to $565. MKM Partners also encouraged boldness going into earnings on Wednesday evening: “MKM Partners also projects strong results and outlook, and ‘would continue to own the stock into the report,’ a recent research note assures. The analysts model EPS of $0.68.”
Altogether, NFLX experienced a tremendous gap up that represents a climax of sorts on top of the rally going into earnings from churn around 200DMA support. Given the leap, of course I attempted a fade. It went well for the first 15 to 20 minutes or so until the stock got a second wind and rallied as high as $485 and a 6.8% gain. The stock did fade from those highs and sent me back to even on the fade. These kinds of gaps well beyond the Bollinger Bands are just about the most dangerous moves imaginable ahead of earnings. The risk of a reversal becomes extremely high as expectations become extremely high (or low in the case of accelerating downside). I am considering holding through earnings…unless I get a good enough fade before that.
Daily T2108 vs the S&P 500
")
Black line: T2108 (measured on the right); Green line: S&P 500 (for comparative purposes)
Red line: T2108 Overbought (70%); Blue line: T2108 Oversold (20%)
Weekly T2108

*All charts created using freestockcharts.com unless otherwise stated
The T2108 Resource Page
Expanded daily chart of T2108 versus the S&P 500
Expanded weekly chart of T2108
Be careful out there!
Full disclosure: long NFLX puts and short shares