
(T2108 measures the percentage of stocks trading above their respective 40-day moving averages [DMAs]. It helps to identify extremes in market sentiment that are likely to reverse. To learn more about it, see my T2108 Resource Page. You can follow real-time T2108 commentary on twitter using the #T2108 hashtag. T2108-related trades and other trades are sometimes posted on twitter using the #120trade hashtag. T2107 measures the percentage of stocks trading above their respective 200DMAs)
T2108 Status: 64.9%
T2107 Status: 52.9%
VIX Status: 13.8
General (Short-term) Trading Call: Mildly bearish – STILL waiting to see what happens when/if T2108 becomes overbought. Solidly bearish on a S&P 500 close below 2085.
Active T2108 periods: Day #88 over 20%, Day #47 above 30%, Day #27 over 40%, Day #16 over 60% (overperiod), Day #158 under 70%
Reference Charts (click for view of last 6 months from Stockcharts.com):
S&P 500 or SPY
SDS (ProShares UltraShort S&P500)
U.S. Dollar Index (volatility index)
EEM (iShares MSCI Emerging Markets)
VIX (volatility index)
VXX (iPath S&P 500 VIX Short-Term Futures ETN)
EWG (iShares MSCI Germany Index Fund)
CAT (Caterpillar).
Commentary
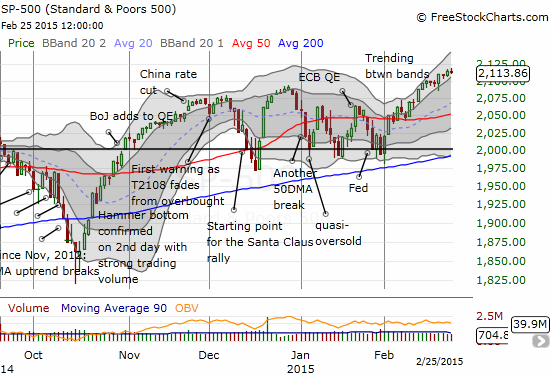
T2108 nudged up a fraction to close at 64.9%. It is playing the same ol’ coy role relative to overbought status looming directly overhead. The S&P 500 barely budged with essentially a flat close. The index remains comfortably placed within an uptrend channel.
The source of my change in the trading call to “mildly bearish” comes from the volatility index and Apple (AAPL).
The volatility index, the VIX, made a strong move upward from its low of the day. The candlestick looks like a hammer bottom in the making.
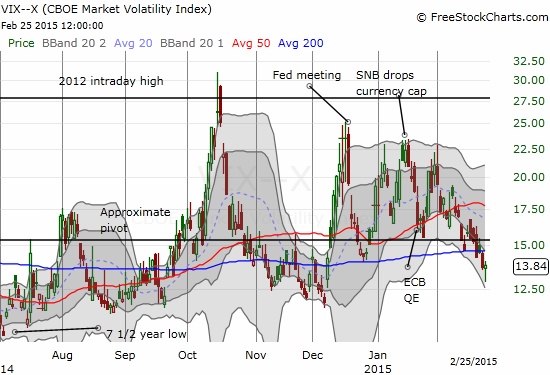
I did not understand why volatility was able to make such a strong comeback given the relatively placid trading on the S&P 500. And then I saw what Apple (AAPL) did.
$AAPL's 2-day decline likely ending nice streak for the NASDAQ. I next expect %stocks>40DMA to tumble finally as leaders stumble. $QQQ
— Dr. Duru (@DrDuru) February 25, 2015
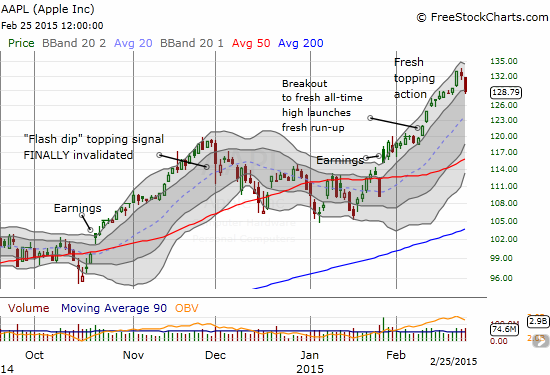
Technically, this drop in Apple appears at first blush relatively benign given the uptrend and its ability to invalidate the last topping signal. However, a closer look shows two days straight of high-volume selling – rarely a benign sign coming off all-time highs (or 52-week highs for that matter). With a market cap twice that of the next largest stock, Apple’s run-up since January earnings feels nearly epic. It seems to make sense to watch Apple for market signals. The market is now guilty until proven innocent, like a fresh all-time high from Apple and/or a continuation of the S&P 500’s run-up.
Beyond what happened today, I have two other signals from this week that have been playing on my mind.
On Monday, 2 days ago, the S&P 500 futures experienced their lowest volume of the year, a potential sign of lack of support for these lofty levels. Yet, one cannot trade on a volume signal alone because the market has largely ignored volume for years now. As MrTopStep said on Monday in the following short video, the market is too high to buy but also too firm to sell. A move up in volatility and high-volume selling on AAPL shake some of that firmness in my opinion.
Also playing on my mind is the subtle “conciliatory” tone suddenly adopted by my favorite permabear. On Monday, he apparently discovered/accepted/conceded trend following.
My guess is that there is a rather large body of traders and investors who have justifiably waited for momentum loss before they sell.
— Douglas Kass (@DougKass) February 23, 2015
For about two years or more (I have lost track), my favorite permabear has fought and fought momentum and trend, practically shouting into the wind. So I take note when instead of shouting “SELL” louder than ever and casting ever heavier aspersions on the market on Twitter, he is taking a more cautious approach.
The ultimate contrarian signal would be for him to actually try to trade with the trend on the S&P 500 (or the NASDAQ), but I am pretty sure he will not do such a thing. He is pretty consistent on rushing to sell/short into run-ups and sometimes rushing to buy sell-offs – he is the consummate contrarian (so ironic then that he himself has so often proven to be a contrarian in these latter years of the bull market). He is also as bearish as ever on Apple. As usual, I have to note I am not picking on him. I even have to admit he has a point about Apple sucking massive amounts of money from the rest of the market (although even in the Barron’s blog post, he is quoted as giving deference to price momentum). Regardless, all-time highs make a lot of bearish sentiments wrong. I just find his tweets appropriately educational from many vantage points.
So with all these things playing on my mind, all it took was for two trading friends of mine to express interest in buying volatility for me to jump on some call options on ProShares Ultra VIX Short-Term Futures (UVXY) right before the close.
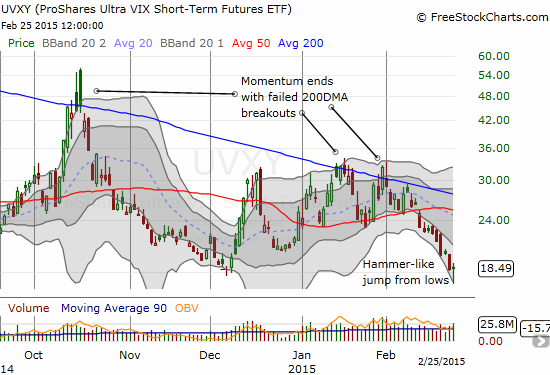
Mind you, this is a VERY tentative trade. I cannot get firmly bearish until the S&P 500 closes below 2085 as I noted in the last T2108 Update.
My charts for today are more bullish than bearish. Strange how I can get focused on charts leaning away from overall trading bias!
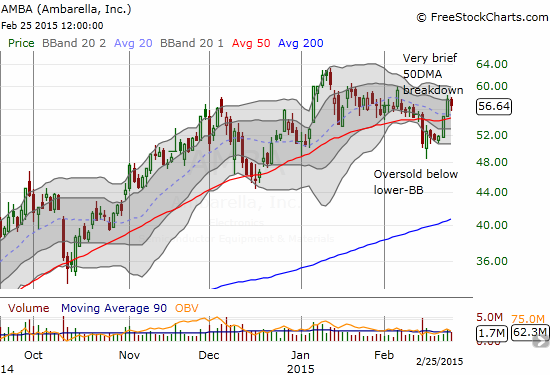
Ambarella (AMBA)
Buyers have returned AMBA to a bullish position. The high-volume 50DMA breakdown I traded with a quickness has become a quick blip on the screen.
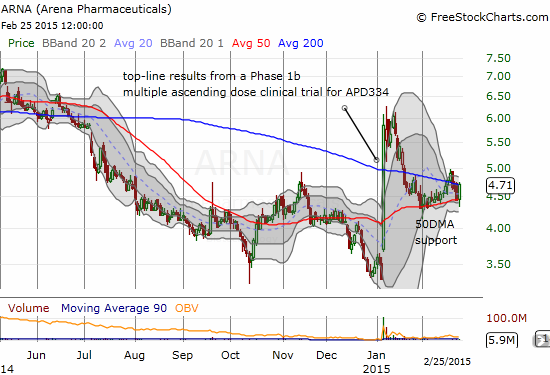
Arena Pharmaceuticals (ARNA)
ARNA caught my fresh attention when it soared 78% in early January. I have patiently waited since then for a buyable pullback to technical support. I have not yet pulled the trigger, but the time seems to be coming soon. Note the technical “ping-pong” around the converging 50 and 200DMA support/resistance.
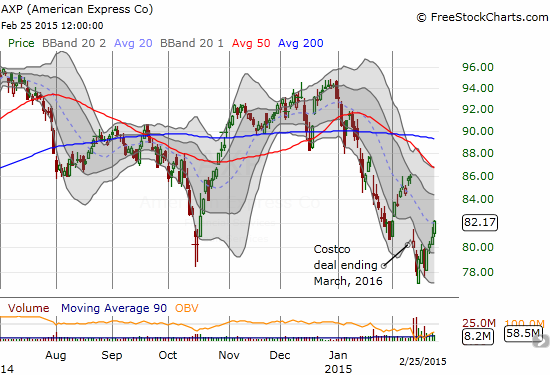
American Express (AXP)
I meant to post on AXP earlier. I went long with call options on Friday, February 13 after AXP followed-through on the previous day’s gap down. I consider this trade similar to the one I described last year for Digital River (DRIV). AXP released awful news about losing Costco (COST), but the company did NOT say that a re-negotiation is off the table. Moreover, I thought the sell-off was way overdone anyway. I bought April call options to give myself plenty of runway, but given my growing bearish tidings on the market I am likely to lock in profits this week.
McDonald’s (MCD)
I stick by my trading/investing call from September last year to accumulate McDonald’s. MCD has since then dipped lower not once, not twice, but THREE times. Vindication finally seems at hand with a huge breakout move today. Strangely enough, I could not find any news…perhaps in combination with AXP’s bounce there are some “value investors” going to work buying up fallen Dow stocks?
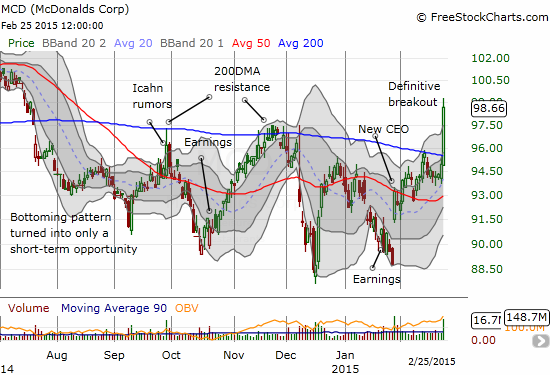
While I am likely to sell my recent call options soon, I am sticking by the shares through whatever pullback is coming in the general market.
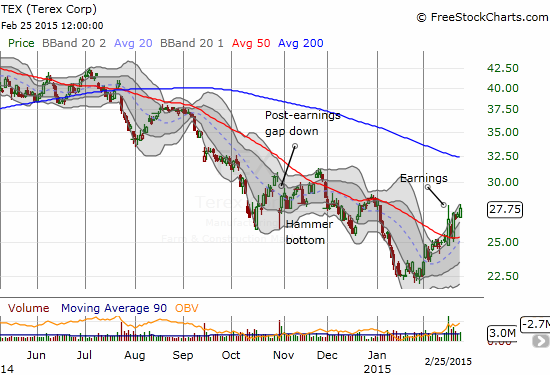
Terex Corporation (TEX)
TEX has fallen with the rest of the commodity complex and has even declined for about a year. The nature of trading in the stock is finally showing a different character. After a post-earnings gap down last October, the stock recovered and even broke through its 50DMA resistance for a short spell. After earnigns last week, TEX gapped down for just a brief moment before rallying right through 50DMA resistance. Support held for two days after that. If TEX prints a higher high, it should make a good risk/reward bottoming play.
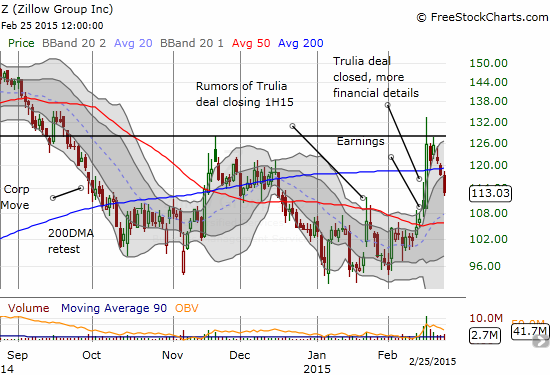
Zillow (Z)
Z fell another 4% today and seems nearly sure to make a complete reversal of last week’s bizarre run-up. I discussed the trade last week.
Source: Schaeffer’s Investment Research
I daresay Zillow will overshoot and at least retest its 50DMA.
Daily T2108 vs the S&P 500
")
Black line: T2108 (measured on the right); Green line: S&P 500 (for comparative purposes)
Red line: T2108 Overbought (70%); Blue line: T2108 Oversold (20%)
Weekly T2108

*All charts created using freestockcharts.com unless otherwise stated
The T2108 Resource Page
Expanded daily chart of T2108 versus the S&P 500
Expanded weekly chart of T2108
Be careful out there!
Full disclosure: long UVXY call options, long AXP call options, long MCD call options and shares, long Z put options and call options