
(T2108 measures the percentage of stocks trading above their respective 40-day moving averages [DMAs]. It helps to identify extremes in market sentiment that are likely to reverse. To learn more about it, see my T2108 Resource Page. You can follow real-time T2108 commentary on twitter using the #T2108 hashtag. T2108-related trades and other trades are sometimes posted on twitter using the #120trade hashtag. T2107 measures the percentage of stocks trading above their respective 200DMAs)
T2108 Status: 64.0%
T2107 Status: 51.7%
VIX Status: 14.3
General (Short-term) Trading Call: Neutral – STILL waiting to see what happens when/if T2108 becomes overbought. Bearish on a S&P 500 close below 2085.
Active T2108 periods: Day #85 over 20%, Day #44 above 30%, Day #24 over 40%, Day #13 over 60% (overperiod), Day #155 under 70%
Reference Charts (click for view of last 6 months from Stockcharts.com):
S&P 500 or SPY
SDS (ProShares UltraShort S&P500)
U.S. Dollar Index (volatility index)
EEM (iShares MSCI Emerging Markets)
VIX (volatility index)
VXX (iPath S&P 500 VIX Short-Term Futures ETN)
EWG (iShares MSCI Germany Index Fund)
CAT (Caterpillar).
Commentary
The S&P 500 (SPY) sank as low as 2085.44 within the first 30 minutes of trading. I thought at last the market was providing a definitive trading signal. Recall that in the last T2108 Update, I drew 2087 as my latest line of support to determine whether to act on the bearish divergence at that time. It is a good thing I usually wait until the market close to make the final call. The S&P 500 traded nearly straight up from its lows, cruising right past the 2100 round number. Notch one more all-time high for the S&P 500.
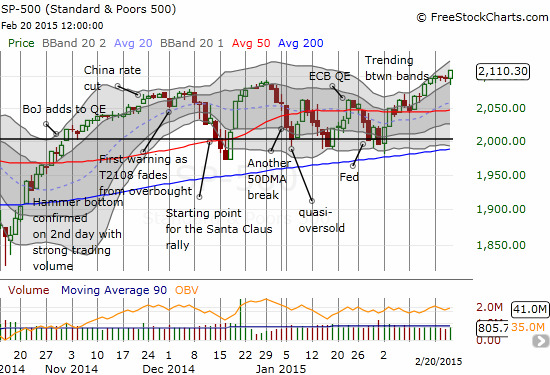
Ordinarily, I would take this opportunity to flip firmly bullish in order to catch what could be a refreshed uptrend. After all, an uptrend between the Bollinger Bands (BB) is starting to unfold. However, the behavior of T2108 continues to confound me. Instead of flipping overbought, T2108 barely budged. It closed at 64.0% and remains below its level two weeks ago when it just missed hitting overbought status. This is now day #155 for T2108 trading outside of overbought conditions. The S&P 500 has gained an incredible 6.7% over this time period. To put this in perspective, see the chart below that shows the S&P 500’s performance charted against the duration of the T2108 70% underperiod (meaning trading outside of overbought conditions).
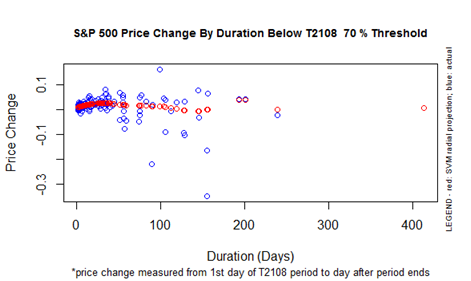
Not only is it extremely rare for T2108 to go this long without hitting overbought conditions, but also the performance of the S&P 500 is at the top of the expected range fror any duration. Moreover, other periods that have gone this long without overbought conditions have delivered very poor performances for the S&P 500. This chart also suggests that the odds are higher than ever that this tease below overbought conditions will end soon – hopefully THIS week!
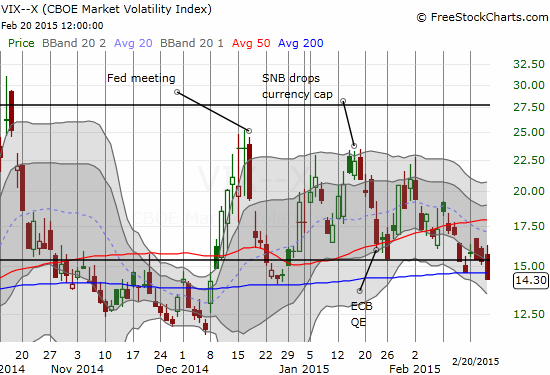
The rally on Friday even succeeded in pushing the volatility index to its lowest point since it last bottomed in late December. Bears can certainly make a case that the odds favor a rebound over further losses for the VIX. The VIX is also now below the 15.35 pivot.
While I remain wary until I see the market’s behavior when T2108 finally hits overbought, I know there have to be some itchy trade fingers out there. I can certainly sympathize with an assessment that the market is once again a train leaving the station. For buyers of the S&P 500, I offer up a simple rule: load up on ProShares Ultra S&P500 (SSO) call options and stop out on a S&P 500 close below 2085. The dip on Friday has moved the dividing line a tad lower but also made that line all the more significant. I will be making a definitive bearish trading call once/if that close occurs. If the S&P 500 manages a strong close into new all-time highs when T2108 hits overbought, I will be inclined to rejoin the bulls (with 2085 as a likely stop).
Two of my other favorite supporting indicators are not helping much in tandem these days.
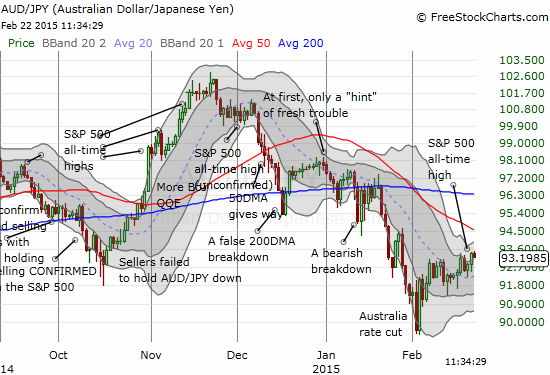
The Australian dollar (FXA) has managed to rally against the Japanese yen in the aftermath of a rate cut from the Reserve Bank of Australia (RBA). This is a bullish development; in retrospect, I could have used this bottom to make a case for playing an eventual breakout on the S&P 500. Now, I am anticipating stiff resistance at the declining 50DMA.
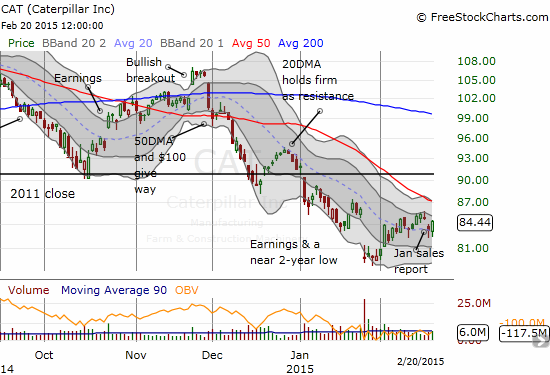
Caterpillar (CAT) reported an awful sales report on Thursday. The stock gapped down and ended its post-earnings relief rally right at the point of closing the post-earnings gap down. This move was a definitive score for the bears. However, the very next day CAT came back and nearly closed the latest gap. I continue to load up on put options on CAT, and any bullish plays I make on SSO will be tuned to the amount of hedging I think I have with CAT.
Here are some of the other charts on my radar:
Zillow (Z)
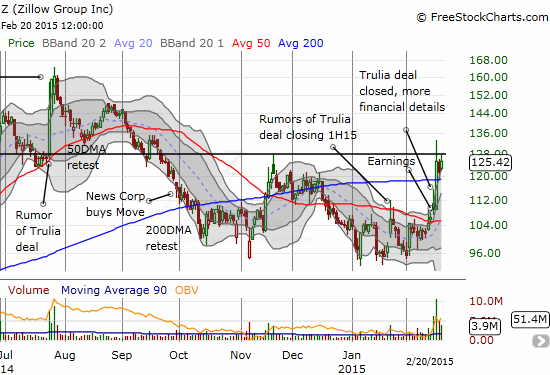
Zillow has surged in response to news that the company has closed its deal to acquire Trulia. I made several trades into this volatility and missed several. I will summarize to say that I was quite stubborn at several points of resistance including the 200DMA and the apparent resistance formed from the launching point when rumors of the Trulia deal sent the stock soaring a whole 7 months ago. The big payoff came on Thursday as the stock dropped back to the upper-Bollinger Band (BB) which happened to coincide with the 200DMA at that point. (Regular readers know how much I like to make contrarian trades on stocks that move extremely far away from the upper/lower BBs). I am still bearish on the stock at these levels but a close above Wednesday’s high will be definitively bullish.
Splunk (SPLK)
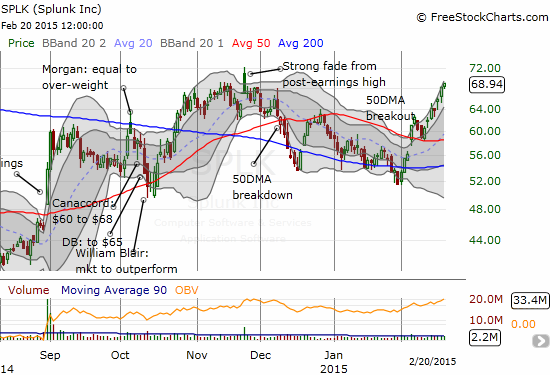
As expected, SPLK surged ahead of earnings. I was not positioned as well as I would have liked and managed not to earn enough on my call options to pay for my puts. These puts are a play on an expected post-earnings plunge. The puts have a strike at $55 and are highly unlikely to benefit from a post-earnings plunge from current levels (definitely a case of poor positioning). With the earnings report not until Thursday, Feb 26, I may re-initiate the hedged trade.
Intercept Pharmaceuticals (ICPT)
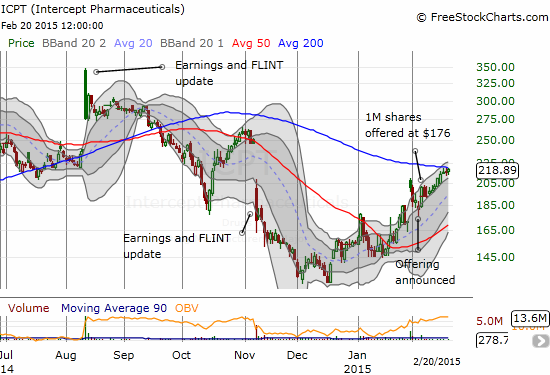
I have written several times about trades on ICPT. My last trade setup was a hedged one going short shares and long call options. I was actually expecting a pullback after the stock offering but instead ICPT has surged well past its $176 offering price. I am thoroughly impressed with the resilience even with these extremely low trading volumes. If the stock manages to breakout above its 200DMA, I will have to assume a fill of the November earnings gap down is in play. I am watching volume closely under the assumption that the next volume surge will point the direction for the next sustained move.
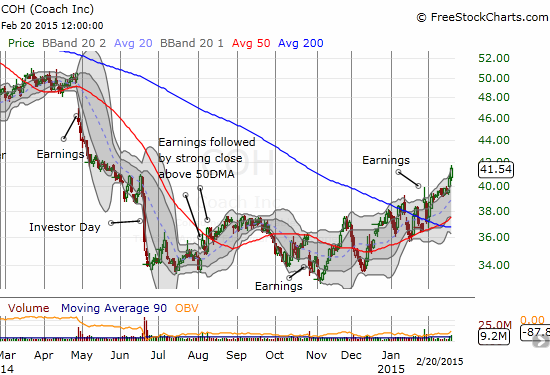
Coach (COH)
COH broke out above its 200DMA several times in January. The final breakout was in response to earnings. The subsequent selling stopped right on the 200DMA. The stock has barely looked back since. It now looks like a bottoming process is confirmed for COH as it finally seems ready to leave behind a lot of post-earnings angst. I will like this stock a LOT when I am in a more bullish mood.
Daily T2108 vs the S&P 500
")
Black line: T2108 (measured on the right); Green line: S&P 500 (for comparative purposes)
Red line: T2108 Overbought (70%); Blue line: T2108 Oversold (20%)
Weekly T2108

*All charts created using freestockcharts.com unless otherwise stated
The T2108 Resource Page
Expanded daily chart of T2108 versus the S&P 500
Expanded weekly chart of T2108
Be careful out there!
Full disclosure: short AUD/JPY, long ICPT call options and short shares, long SPLK put options, long Z put options, long CAT put options