
(T2108 measures the percentage of stocks trading above their respective 40-day moving averages [DMAs]. It helps to identify extremes in market sentiment that are likely to reverse. To learn more about it, see my T2108 Resource Page. You can follow real-time T2108 commentary on twitter using the #T2108 hashtag. T2108-related trades and other trades are sometimes posted on twitter using the #120trade hashtag. T2107 measures the percentage of stocks trading above their respective 200DMAs)
T2108 Status: 38.8% (a 23.4% drop!)
T2107 Status: 45.5%
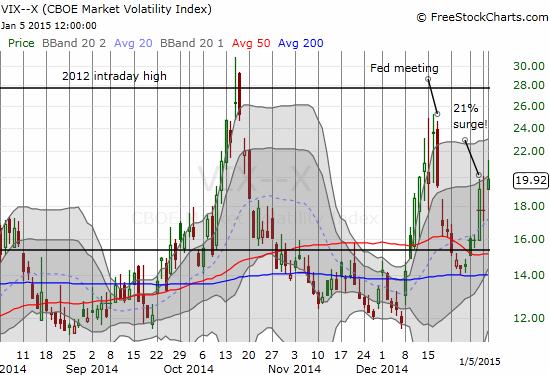
VIX Status: 19.9 (barely higher than the close from 2 trading days ago)
General (Short-term) Trading Call: Hold. Aggressive bears can short with stops above the 50DMA. As usual, there is a high risk of churn for such trades. Bulls should prepare for oversold trading conditions.
Active T2108 periods: Day #53 over 20%, Day #12 above 30% (overperiod), Day #1 under 40%, Day #3 under 50%, Day #21 under 60%, Day #123 under 70%
Reference Charts (click for view of last 6 months from Stockcharts.com):
S&P 500 or SPY
SDS (ProShares UltraShort S&P500)
U.S. Dollar Index (volatility index)
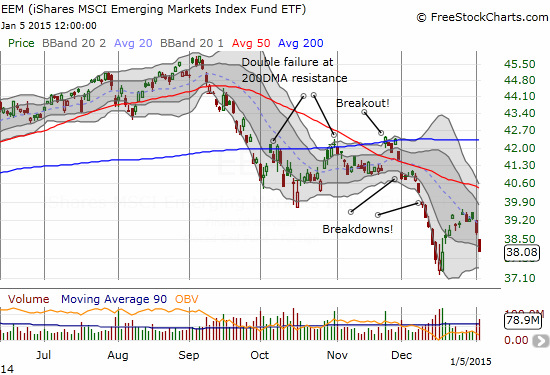
EEM (iShares MSCI Emerging Markets)
VIX (volatility index)
VXX (iPath S&P 500 VIX Short-Term Futures ETN)
EWG (iShares MSCI Germany Index Fund)
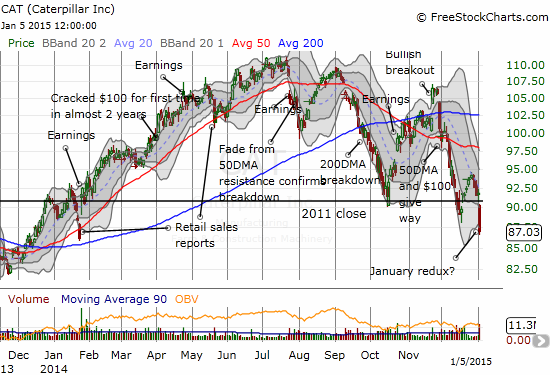
CAT (Caterpillar).
Commentary
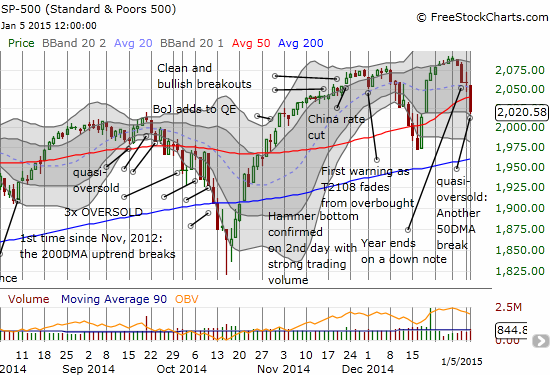
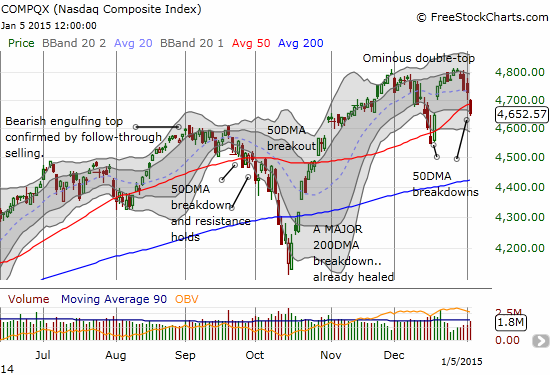
The S&P 500 (SPY) lost 1.8%; another 1% drop and 2014’s Santa Claus rally completes a full reversal.
When I wrote about the historic jump in volatility in the last T2108 Update and then followed up with a more detailed analysis, I did not provide any projection or analysis for what might come next. I was short on time and could only run some preliminary numbers for performance. I did not observe anything significant. With the S&P 500 following up two trading days later with another significant sell-off and an even more important break of its 50DMA, I have now made a mental note to go back and take a look at multiple periods of performance, including typical lifetimes for the Santa rally (similar to my analysis of the Black Friday trade).
In the meantime, there are plenty of data points to cause additional concern in the short-term. For some context on my coming bearish observations, recall that my best projection for the short-term period was a lot of chop. This current pullback sits well within the range of chop. A break of December’s low and then a break of the 200DMA will force me to do a rethink. T2108 is also starting to work as a cushion for the market’s fall. My favorite technical indicator plunged a whopping 23% to 38.8%. A drop on Tuesday will put T2108 in quasi-oversold territory. Moreover, a cross of the 40% threshold (the 40% underperiod) gets me thinking about and preparing for oversold scenarios. T2108 could easily go oversold just as the S&P 500 is retesting support at the 200DMA or December low. Finally, the volatility index, the VIX, popped 11.4% but it is barely 4% higher than its close from two days ago. On THAT day, the last day of 2014, the VIX surged 21% seemingly out of nowhere.
My response to last week’s burst of volatility was to fade it with a small purchase of shares in ProShares Short VIX Short-Term Futures (SVXY) to fade the surge. The very next day I got a sufficient pullback to close out the trade, but I ended up holding on for follow-through. Instead of profitable follow-through, I found myself expanding the anti-volatility bet with puts on ProShares Ultra VIX Short-Term Futures (UVXY). I will not further expand the position until/unless T2108 closes in on oversold conditions.
Make no mistake though, the short-term bias is bearish. There was broad-based weakness across individual equities that I follow as health indicators:
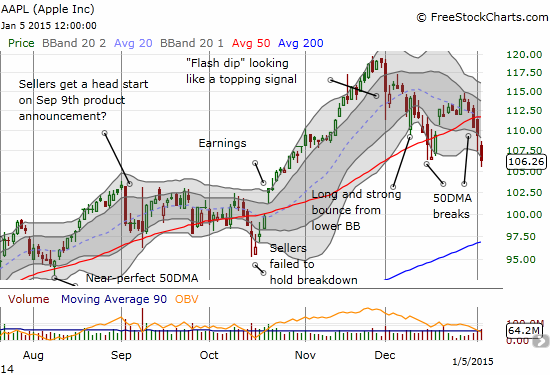
- Apple (AAPL) experienced follow-through selling from its 50DMA breakdown last week. (I have updated the Apple Trading Model with full 2014 data. It projected a decline for today that I somehow managed to miss!)
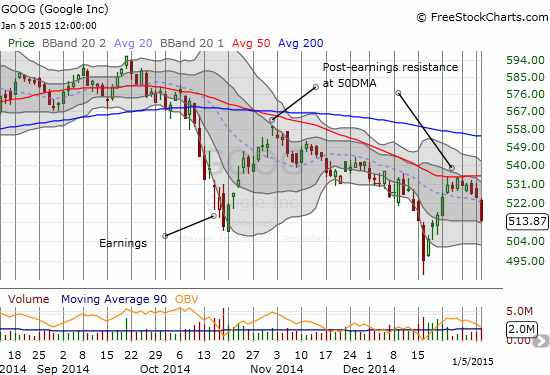
- Google (GOOG) followed through with its failed retest of 50DMA resistance and triggered a short trade that I explained last week.
- Caterpillar (CAT) was walloped for a nasty 5.3% loss. I sold puts on my favorite hedge a day too early, leaving a LOT of profits on the table.
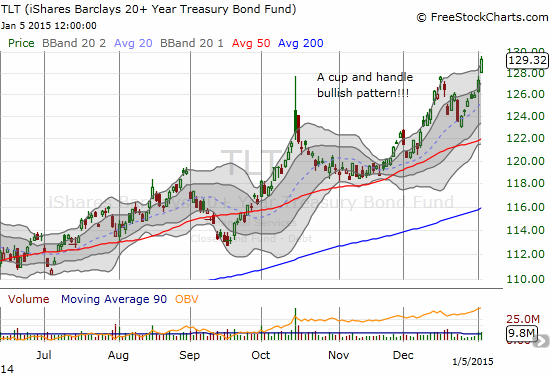
- Bond yields managed to go even LOWER and iShares 20+ Year Treasury Bond (TLT) punched out a fresh 2 1/2 year high. Remember, this is ahead of what is supposed to be the beginning of a Fed rate-tightening cycle.
Here are all the relevant charts:
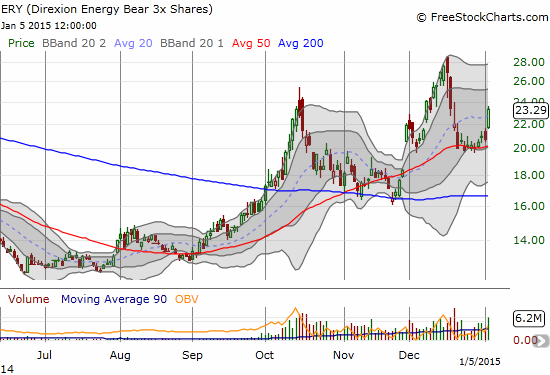
In other trades I have noted earlier: I closed out put options on iShares MSCI Emerging Markets (EEM) as EEM cleanly followed through on selling from its downward sloping 20DMA; I sold my shares in Direxion Daily Energy Bear 3X ETF (ERY) as it surged to a double-digit gain in the wake of another massive sell-off in the oil patch.
There are also a LOT of other indicative charts. I post just a few more here.
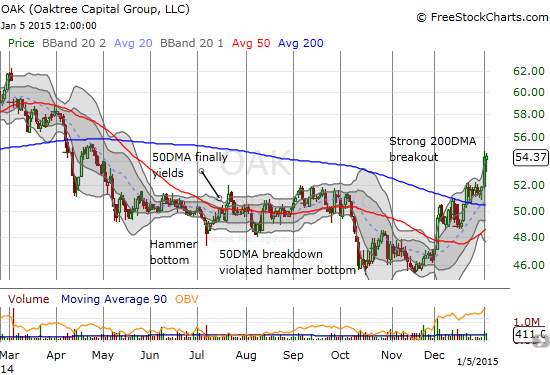
So, I will not be surprised by follow-through selling all the way down to the S&P 500’s 200DMA support. However, to avoid ending on a negative note, I have one bullish follow-through to note: Oaktree Capital Group (OAK) is FINALLY following through on the bottoming pattern I thought I had identified last summer…
Daily T2108 vs the S&P 500
")
Black line: T2108 (measured on the right); Green line: S&P 500 (for comparative purposes)
Red line: T2108 Overbought (70%); Blue line: T2108 Oversold (20%)
Weekly T2108

*All charts created using freestockcharts.com unless otherwise stated
The T2108 Resource Page
Expanded daily chart of T2108 versus the S&P 500
Expanded weekly chart of T2108
Be careful out there!
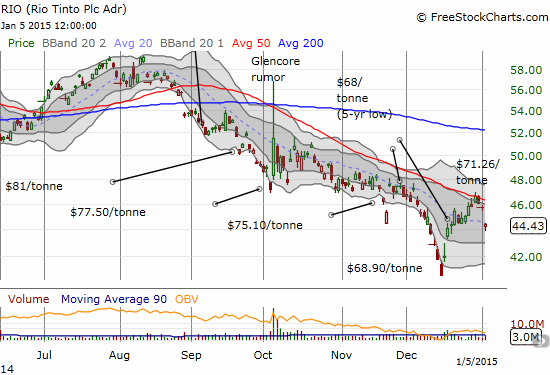
Full disclosure: short GOOG, long AAPL call options, long SVXY, long UVXY put options, long RIO puts