
(T2108 measures the percentage of stocks trading above their respective 40-day moving averages [DMAs]. It helps to identify extremes in market sentiment that are likely to reverse. To learn more about it, see my T2108 Resource Page. You can follow real-time T2108 commentary on twitter using the #T2108 hashtag. T2108-related trades and other trades are sometimes posted on twitter using the #120trade hashtag. T2107 measures the percentage of stocks trading above their respective 200DMAs)
T2108 Status: 62.8%
T2107 Status: 51.2%
VIX Status: 14.0
General (Short-term) Trading Call: Hold (bullish positions)
Active T2108 periods: Day #23 over 20%, Day #21 over 30%, Day #18 over 40%, Day #16 over 50%, Day #11 over 60% (overperiod), Day #93 under 70% (underperiod)
Reference Charts (click for view of last 6 months from Stockcharts.com):
S&P 500 or SPY
SDS (ProShares UltraShort S&P500)
U.S. Dollar Index (volatility index)
EEM (iShares MSCI Emerging Markets)
VIX (volatility index)
VXX (iPath S&P 500 VIX Short-Term Futures ETN)
EWG (iShares MSCI Germany Index Fund)
CAT (Caterpillar).
Commentary
Watching T2108 has become similar to watching the grass grow while paint dries. Today T2108 closed slightly down at 62.8% and is now on an 11th day levitating above 60% without hitting overbought levels. The S&P 500 (SPY) declined fractionally with a 0.15% loss as buyers convincingly picked the index off its lows for the day.
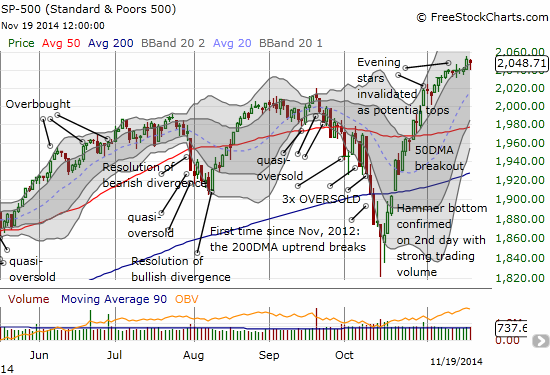
There is not a lot to say about T2108 until this consolidation period ends with a breakdown or breakout. I mainly posted today to showcase two charts of interest: Alibaba (BABA) and Netflix (NFLX).
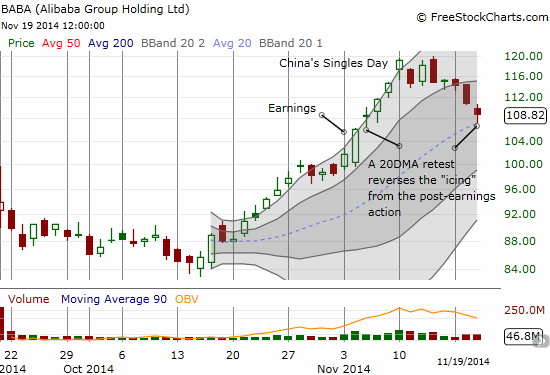
Ironically enough, the “Ali Rah Rah Pop” is leaving behind Alibaba (BABA). The market hype around China’s Singles Day seems to have exhausted buying power for the moment. BABA has declined 5 out of 7 days since then even as the S&P 500 has continued to creep higher. Now, BABA has neatly retested its strong uptrend defined by the 20-day moving average (DMA). I am betting this support will hold. However, there is no need to play “hero” on a stock like this. I will not buy until the buying power shows up again in the stock. A great signal for that possibility is a trade above today’s intraday high of $110.68. A natural stop from this position would be today’s intraday low essentially at the 20DMA at $107.08. Such a break would immediately put the $100 level and a complete post-earnings reversal into play.
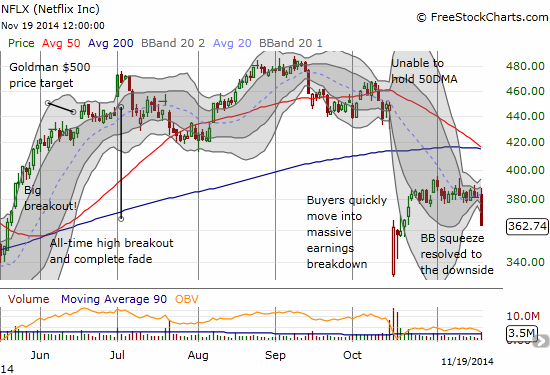
I last covered Netflix (NFLX) on October 24th. At the time, I suggested that NFLX’s post-earnings upward momentum was likely coming to an end, and I set around $379 as a line in the sand to define a shortable breakdown. The very next day, NFLX dropped below that line only to close marginally above it. Two days later NFLX closed below the line and I took the bait buying a $365/355 put spread that expires THIS Friday. NFLX then proceeded to pop to a fresh post-earnings high before settling back into an extended range of churn.
Going into this week, I had all but given up on the put spread until “something” happened today to cause NFLX to plunge 4.7% on high volume. At the time of writing, I still have yet to find any solid news to explain the drop. Without any news, I was VERY tempted to lock in my profits and thank my lucky stars, but this drop looks so ominous I felt it was worth the risk to hold for at least one more day. Granted, NFLX is extended well below its lower-Bollinger Band and could snap right back if some catalyzing news does not appear soon. In favor of the sellers is a breakdown from a Bollinger Band (BB) squeeze. As I have shown in previous charts, the market tends to sustain big moves out of a BB squeeze.
In other news, the oil patch is still on shaky ground. PowerShares DB Oil ETF (DBO) continues to precariously tip toe along a support line that has held since May 2009. Halliburton (HAL) has been (rightfully) punished for the premium it is paying to acquire oil-patch competitor Baker Hughes (BHI). HAL closed at a fresh 10-month closing low, dragging down BHI as well. BHI now looks ready to completely reverse all its gains since the acquisition deal was officially announced. The price action here continues to be important to watch. I am kicking myself because this was a VERY rare case of free money in an inefficient market. HAL declined just as I said it should after announcing this deal, and BHI still moved higher even though deal rumors had already sent the stock much higher. Yet, I did not take either side of this trade. Another lesson learned!
Daily T2108 vs the S&P 500
")
Black line: T2108 (measured on the right); Green line: S&P 500 (for comparative purposes)
Red line: T2108 Overbought (70%); Blue line: T2108 Oversold (20%)
Weekly T2108

*All charts created using freestockcharts.com unless otherwise stated
The T2108 Resource Page
Expanded daily chart of T2108 versus the S&P 500
Expanded weekly chart of T2108
Be careful out there!
Full disclosure: long SSO shares, long NFLX put spread