
(T2108 measures the percentage of stocks trading above their respective 40-day moving averages [DMAs]. It helps to identify extremes in market sentiment that are likely to reverse. To learn more about it, see my T2108 Resource Page. You can follow real-time T2108 commentary on twitter using the #T2108 hashtag. T2108-related trades and other trades are sometimes posted on twitter using the #120trade hashtag. T2107 measures the percentage of stocks trading above their respective 200DMAs)
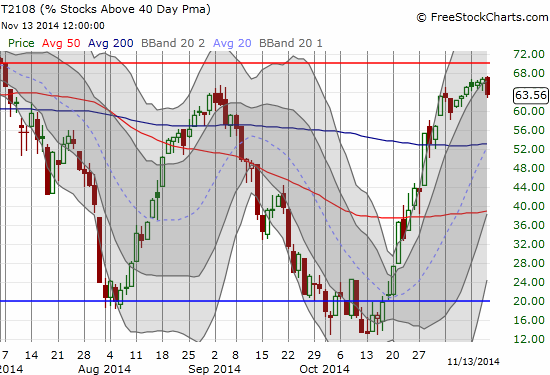
T2108 Status: 63.6%
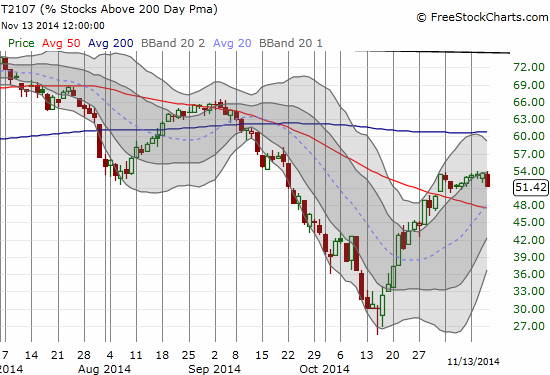
T2107 Status: 51.4%
VIX Status: 13.8 (held 2-month closing low)
General (Short-term) Trading Call: Hold (bullish positions); aggressive bears can short with a tight stop at fresh all-time highs
Active T2108 periods: Day #19 over 20%, Day #17 over 30%, Day #14 over 40%, Day #12 over 50%, Day #7 over 60% (overperiod), Day #89 under 70% (underperiod)
Reference Charts (click for view of last 6 months from Stockcharts.com):
S&P 500 or SPY
SDS (ProShares UltraShort S&P500)
U.S. Dollar Index (volatility index)
EEM (iShares MSCI Emerging Markets)
VIX (volatility index)
VXX (iPath S&P 500 VIX Short-Term Futures ETN)
EWG (iShares MSCI Germany Index Fund)
CAT (Caterpillar).
Commentary
A ray of hope just opened for the bears…or a fresh nightmare is about to begin. This is the dichotomy the technical signals are flashing to me right now.
The S&P 500 (SPY) has made almost no progress all week: 8 points for a 0.4% gain so far. The last three days have been true stalemates with candlestick patterns known as “evening stars.” These are typically topping patterns at the end of a run-up. An evening star proceeded the sell-off that led to the October correction. An evening start that started the month of November only stalled the rally for another day.
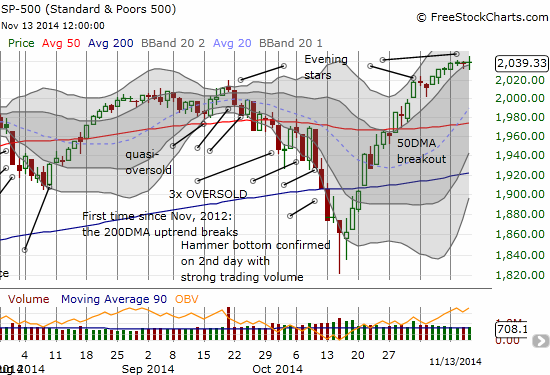
This week’s pattern of evening stars matter a lot more because at the same time T2108 closed down ominously just short of overbought (70% or higher) – a little similar to what happened in September.
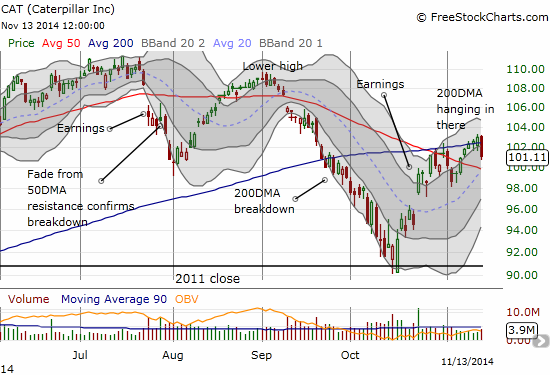
Caterpillar (CAT) is adding to the wariness as it continues to struggle to move through its 200DMA. I earlier thought CAT was about the burst through this resistance and issue a clear, bullish market signal.
So that is the bearish case. It is a warning sign, but not a sell sign for me just yet. First of all, I want confirmation: a notable drop in the S&P 500 in the next day or two would do the trick. Aggressive bears who have been pained to find new reasons to hate the market can short here with a tight stop at fresh all-time highs. I am fine avoiding the bearish bandwagon until/unless the S&P 500 closes below 2000 or even its 50DMA. I am sticking with my plan to hold my hard-earned shares in ProShares Ultra S&P500 (SSO). I also have call options expiring next Friday that I will just ride out. I will give fresh consideration to loading up more on put options on CAT as a firm hedge.
So what is the case for a coiled spring?
First, T2107, the percentage of stocks trading below their respective 200DMAs, is nowhere close to its previous high or even the post-recession downtrend line. This represents potential upside and shows there are still stocks out there that buyers might find relatively “cheap.” Bears of course will see this as exhaustion at critical resistance (for example, CAT).
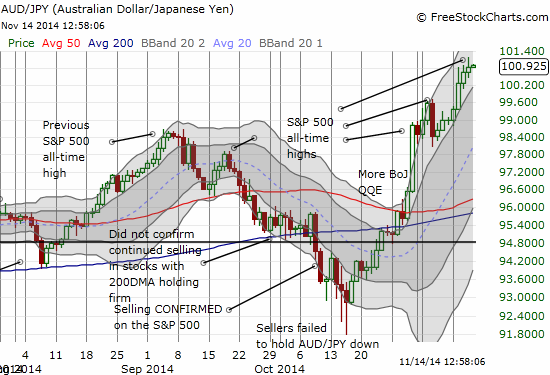
On the forex front, the Australian dollar versus the Japanese yen (AUD/JPY) is as bullish as it can be. It is not signalling or confirming any downward move here. Note how AUD/JPY turned downward at the September 19 peak and proceeded to accompany the stock market downward.
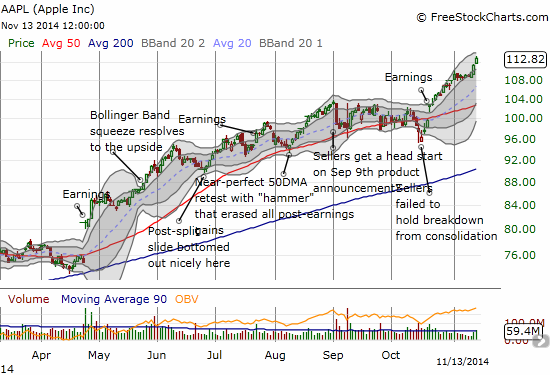
And how can a trader hate a market that is still sending Apple (AAPL) to clean breakouts to fresh all-time highs on good buying volume? The post-earnings uptrend is a thing of technical beauty.
THESE signals bias me to continue thinking of the S&P 500 as a coiled spring that will further confirm the “Ali Rah Rah Pop.” A clean breakout to fresh all-time highs will be VERY bullish as it will completely invalidate the bearish side of the argument I showed above. Stay tuned and brace yourselves.
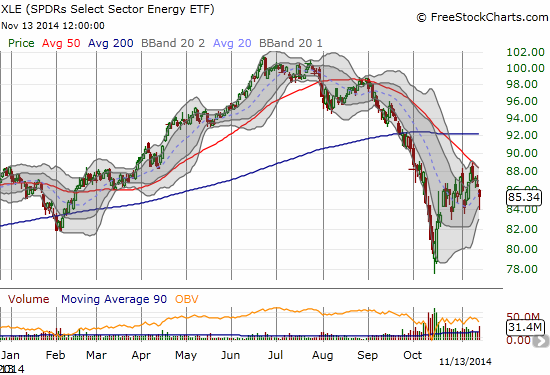
I have one very important trading update from the energy complex. In my last T2108 Update, I described the setup for shorting Energy Select Sector SPDR ETF (XLE). It was as simple as could be: shorting XLE as it faded from 50DMA resistance. Today delivered a clean breakdown that allowed me to lower my stop and lock in profits. I continued to lower the stop as XLE continued plunging. Just as I was starting to wonder how low XLE might go, HUGE news broke near the close of trading.
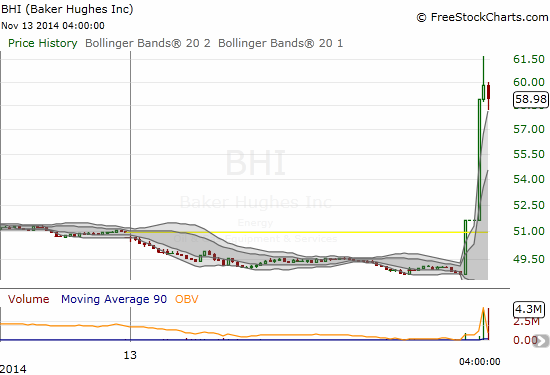
Halliburton in talks to buy oil-field-services company Baker Hughes http://t.co/4euSXR3Agm
— WSJ Breaking News (@WSJbreakingnews) November 13, 2014
So many thoughts ran through my mind at once, but at least I had enough clarity of thought and purpose to know the first and most important implication: XLE is likely done selling off. Baker Hughes (BHI) is not in the top 10 holdings of XLE. In fact, Exxon (XOM) and Chevron (CHV) make up a hearty 30% of the ETF. Halliburton (HAL) is in the top 10 but a mere 3.3% of XLE. None of that matters. What matters is the potential shift in sentiment that can come from a deal like this. Investors and traders alike will, probably rightly, interpret such a deal as signal of some kind of bottom in the oil patch – a signal that they should be bargain-hunting along with HAL. Indeed, XLE immediately started higher into the close, and I quickly covered my position and locked in the remaining profits.
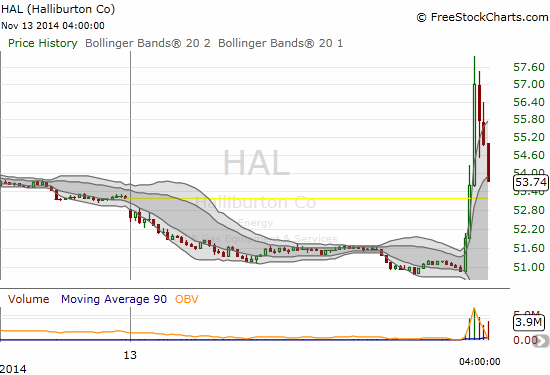
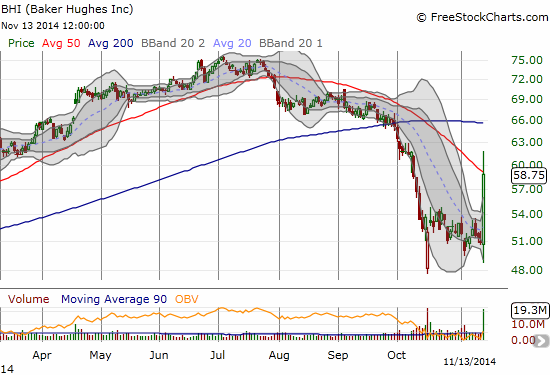
I am also VERY grateful I did not haplessly target a single company to short in the oil patch. XLE was a great choice exactly because I did not need to worry much about waking up some morning to find a merger announcement plunging my short position into an instant and very large loss. The ramp in BHI was an amazing site to behold (yes, I was too busy watching to dare a buy myself!). Even HAL initially benefited. In retrospect HAL made for a great fade given it makes little sense for HAL to surge immediately on a deal where it is likely to spend a massive amount of money/capital – not to mention no details are known. The intraday charts are 5-minute views.
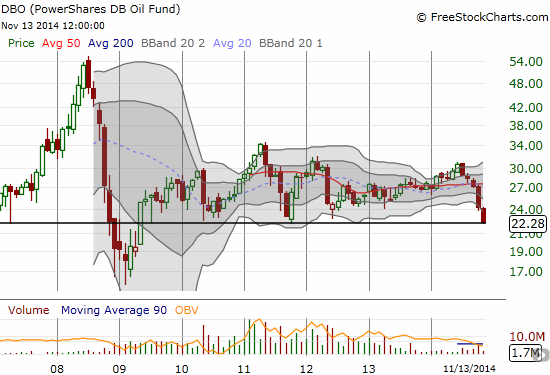
This deal could be well-timed to carve out a bottom in the oil patch. PowerShares DB Oil ETF (DBO) freshly plunged today and officially retested 5-year support.
Since energy is about 12% of the S&P 500 (I heard this from a podcast from Investor’s Business Daily), a turn-around in the oil patch may be just the incremental push the S&P 500 needs to pop that coiled spring…
Daily T2108 vs the S&P 500
")
Black line: T2108 (measured on the right); Green line: S&P 500 (for comparative purposes)
Red line: T2108 Overbought (70%); Blue line: T2108 Oversold (20%)
Weekly T2108

*All charts created using freestockcharts.com unless otherwise stated
The T2108 Resource Page
Expanded daily chart of T2108 versus the S&P 500
Expanded weekly chart of T2108
Be careful out there!
Full disclosure: long SSO shares and call options, long CAT put options