
(T2108 measures the percentage of stocks trading above their respective 40-day moving averages [DMAs]. It helps to identify extremes in market sentiment that are likely to reverse. To learn more about it, see my T2108 Resource Page. You can follow real-time T2108 commentary on twitter using the #T2108 hashtag. T2108-related trades and other trades are sometimes posted on twitter using the #120trade hashtag. T2107 measures the percentage of stocks trading above their respective 200DMAs)
T2108 Status: 68.3%
T2107 Status: 53.3%
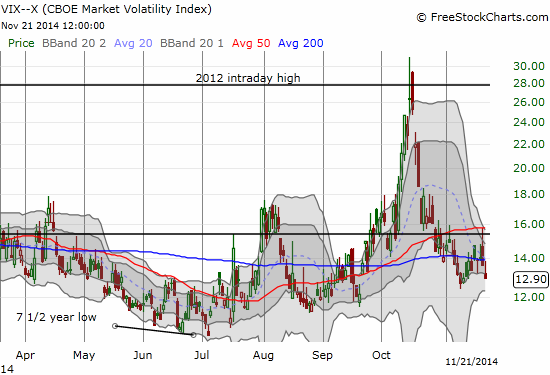
VIX Status: 12.9
General (Short-term) Trading Call: Hold (bullish positions)
Active T2108 periods: Day #25 over 20%, Day #23 over 30%, Day #20 over 40%, Day #18 over 50%, Day #13 over 60% (overperiod), Day #95 under 70% (underperiod)
Reference Charts (click for view of last 6 months from Stockcharts.com):
S&P 500 or SPY
SDS (ProShares UltraShort S&P500)
U.S. Dollar Index (volatility index)
EEM (iShares MSCI Emerging Markets)
VIX (volatility index)
VXX (iPath S&P 500 VIX Short-Term Futures ETN)
EWG (iShares MSCI Germany Index Fund)
CAT (Caterpillar).
Commentary
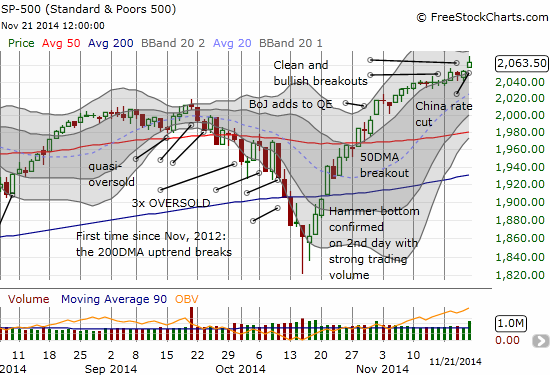
The paint has finally dried and the grass has grown. On Friday, November 21, T2108 experienced a brief encounter with overbought conditions (70% or higher). My favorite technical indicator reached as high as 71.3% before settling in for a close of 68.3%.
This milestone is “close enough” for trading purposes to initiate the overbought trading strategy. I am keeping if VERY simple.
In the coming week, if the S&P 500 closes below its low from Friday of 2056.76, I will assume some kind of top is in the market – definitely not “THE” top. I doubt I will try to chase the S&P 500 (SPY) lower with ProShares Ultra S&P500 (SSO) put options, but I will stop buying every dip with SSO call options. I will get much more comfortable shorting individual stocks at key technical levels. However, it is VERY difficult for me to get outright bearish on the market at this juncture without a breach of some major technical level, like 2000 or the 50DMA.
If the S&P 500 presses higher into overbought territory, I will assume the market is embarking on an overbought rally. In this case, I think the rally could be quite powerful given all the news recently of more stimulus from major central banks (China and the ECB). My strategy in this scenario will be to continue aggressively buying dips on SSO with call options. I will also lock in profits on select longs in individual stocks. This strategy only ends once a technical topping pattern appears (like a blow-off top) or T2108 drops out of overbought conditions.
Interestingly, the VIX still has not quite hit a new low for this up cycle. It is still about 20% away from the 7 1/2 -year low it hit back in early July. So technically, there should be plenty of room to the downside for the VIX before I need to consider extremes of complacency. Still, I would feel “more comfortable” staying bullish if the VIX were closer to the 15.35 pivot point. A little bit of fear indicates buying power still waits on the sidelines.
There are some VERY interesting, intriguing, and likely meaningful chart patterns to review. I post a few below.
Caterpillar, Inc. (CAT)
As regular readers know, I actively use CAT as a market indicator and a hedge whenever I am feeling very bullish (like now). On Friday, CAT made a very clean breakout. It gapped up over its 200DMA. This is as bullish as it can get. If CAT surpasses the high from September, traders should assume the stock has resumed its uptrend. Before THAT happens, traders should assume this breakout is a very bullish sign for the stock market in general. I plan to renew my hedge using CAT to enjoy the discount on the put options that I hope will help protect my backside as I look onward and upward.
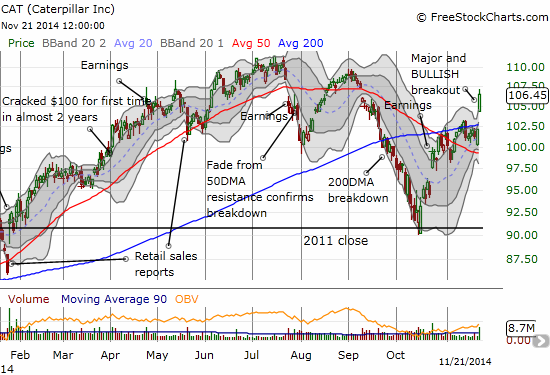
GM, F and CAT are my most "comfortable" shorts. $CAT
— Douglas Kass (@DougKass) November 4, 2014
In my humble opinion, there are NO comfortable shorts when the market is in bull mode…and especially when central banks around the globe are actively working against deflation and slowdowns in growth.
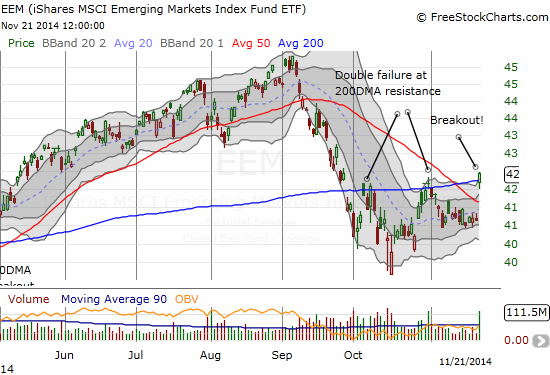
iShares MSCI Emerging Markets (EEM)
Speaking of central bank stimulus, emerging markets got a tremendous boost from Friday’s action. EEM reflects the fresh bullishness in a big breakout above its 200DMA on strong buying volume. This milestone marked a great time to re-initiate another one of my favorite trades, a hedged strategy on EEM of buying call and put options. EEM can travel far and very quickly, and the options are usually not priced for such a possibility. In this case, I biased to the long side given the technical breakout. I like having the put options because they serve double-duty: a hedge on my overall bullishness as well as a potentially profitable side of the trade if this entire setup turns into a vicious fake-out.
The rest of these charts are interesting more from the perspective of the individual stock and not as implications for the larger market.
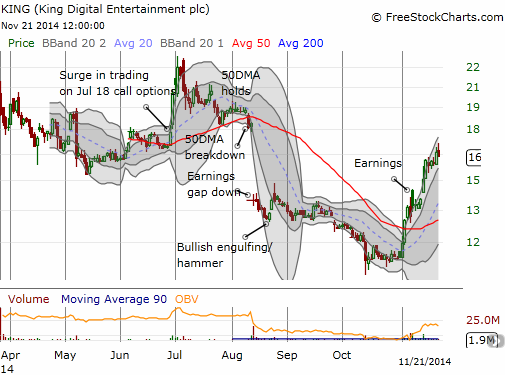
King Digital Entertainment plc (KING)
I should have been ready for this nice burst off the bottom given my previous bullishness on KING, but I sheepishly acknowledge I completely missed it. The clean breakout above the 50DMA has been confirmed by post-earnings follow-through.
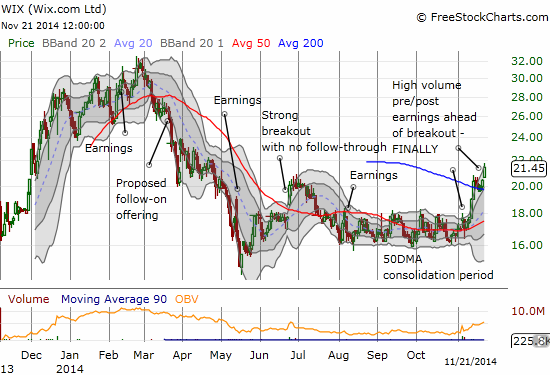
Wix.com Ltd. (WIX)
I have stubbornly stuck by WIX and have FINALLY been rewarded. This is one I will continue to hold.
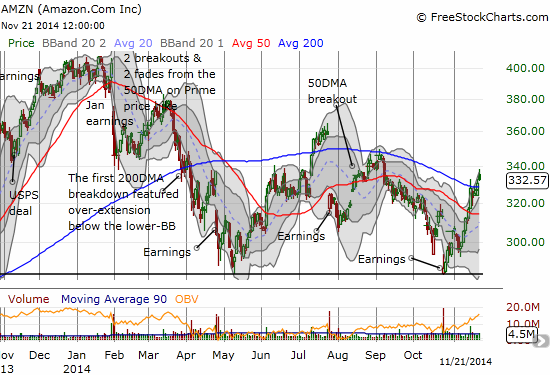
Amazon.com Inc. (AMZN)
All year AMZN has had poor post-earnings performances. Two of the four have featured complete comebacks. This latest one, featuring an important 200DMA breakout, is particularly impressive given analysts and pundits insisted that investors were finally fed up with AMZN’s profitless growth. I guess not quite yet… Having said that, I LOVE AMZN as a short if (when?) it sneaks back below its 200DMA.
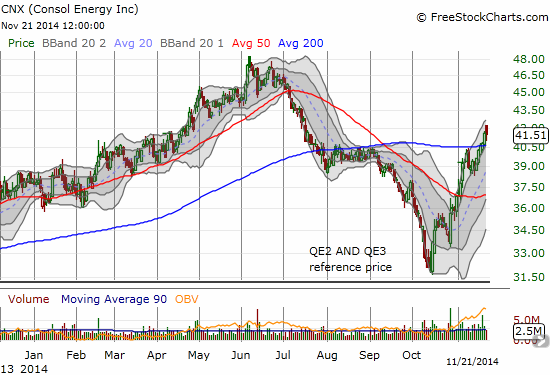
CONSOL Energy Inc. (CNX)
An energy company making a bullish move? Especially one that extracts COAL as part of its business?! That is indeed what we have with CNX. I follow CNX casually, but I should have been paying closer attention with that earlier retest of the QE2 and QE3 reference price.
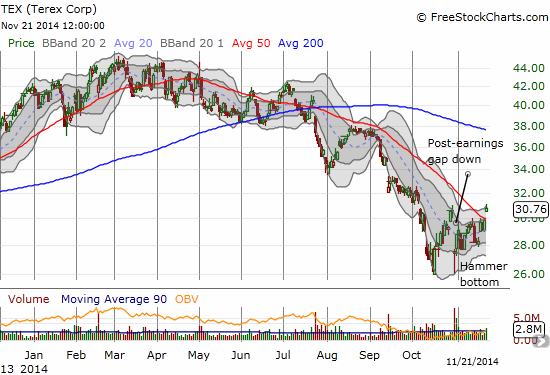
Terex Corporation (TEX)
I consider TEX a poor man’s CAT. You can bet with CAT”s bullish breakout, I am watching TEX with keen interest. TEX has its own “mini” breakout going on above its 50DMA. This is a much more difficult trade than CAT on the bullish side given the downtrend is steep and well intact. TEX has filled its post-earnings gap down from last month, but it needs to close ABOVE its intraday high directly ahead of earnings before I even dare consider taking the bait. I do like the hammer pattern that followed earnings. The “tail” is a bit long for my liking, but the post-earnings follow-through produces a convincing confirmation of a bottom. I just need one more confirmation…
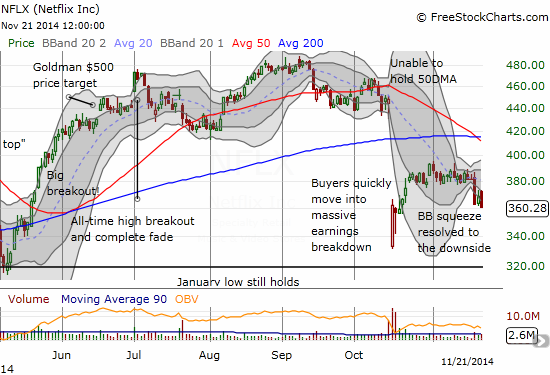
Netflix, Inc. (NFLX)
Last and definitely least among this current crowd of breakout charts is NFLX. I STILL see no solid news explaining the sudden bout of weakness. The technicals tell me all I need to know for now though. I covered this trade and the decisions confronting me in the last T2108 Update. As I feared, NFLX popped from its over-extension below the lower-Bollinger Band. However, given my running suspicion that “something” is up, I took the opportunity to fade NFLX with put options expiring on Black Friday (this coming week). After NFLX obliged with a fade from its intraday high, I went ahead and locked in the profit. On Friday, the selling resumed and took NFLX to a low for the week. It began with a gain at the open and again I went after put options. This time, my profit-taking was pre-mature, and I left a LOT on the table by the close. The good news for me was that I was in the end able to close out the original bearish trade with the 365/355 put spread with a profit.
I almost feel naked without having a fresh set of put options on NFLX going into the week. Needless to say, I will continue to look for opportunities to fade the stock.
Daily T2108 vs the S&P 500
")
Black line: T2108 (measured on the right); Green line: S&P 500 (for comparative purposes)
Red line: T2108 Overbought (70%); Blue line: T2108 Oversold (20%)
Weekly T2108

*All charts created using freestockcharts.com unless otherwise stated
The T2108 Resource Page
Expanded daily chart of T2108 versus the S&P 500
Expanded weekly chart of T2108
Be careful out there!
Full disclosure: long SSO shares, log EEM put and call options,