(T2108 measures the percentage of stocks trading above their respective 40-day moving averages [DMAs]. It helps to identify extremes in market sentiment that are likely to reverse. To learn more about it, see my T2108 Resource Page. You can follow real-time T2108 commentary on twitter using the #T2108 hashtag. T2108-related trades and other trades are posted on twitter using the #120trade hashtag)
T2108 Status: 26.1%
VIX Status: 14.9%
General (Short-term) Trading Call: Hold (TRADERS REMAIN READY FOR WIDE SWINGS)
Active T2108 periods: Day #314 over 20% (includes day #280 at 20.01%), Day #1 over 30%, Day #7 under 40% (underperiod), Day #9 under 50%, Day #11 under 60%, Day #53 under 70%
Reference Charts (click for view of last 6 months from Stockcharts.com):
S&P 500 or SPY
SDS (ProShares UltraShort S&P500)
U.S. Dollar Index (volatility index)
EEM (iShares MSCI Emerging Markets)
VIX (volatility index)
VXX (iPath S&P 500 VIX Short-Term Futures ETN)
EWG (iShares MSCI Germany Index Fund)
CAT (Caterpillar).
Commentary
When T2108 closes below 30%, it is time to get on high alert.
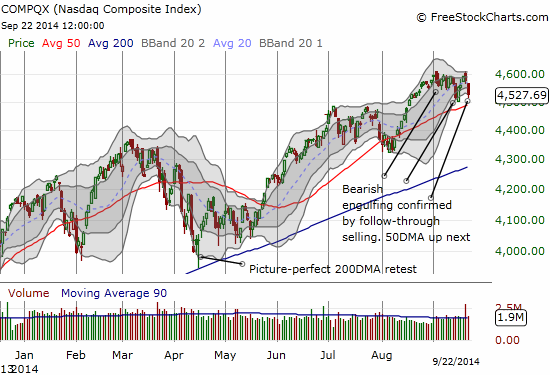
I am torn, however, as I cannot issue a definitive buy or sell recommendation: 1) the S&P 500 (SPY) and the NASDAQ (QQQ) have printed ominous topping patterns this month (as described in previous posts), and 2) no major technical levels have broken to the downside. It is an odd state of limbo for the T2108 Update as conditions rapidly approach true oversold (below 20%)!
Let’s start with quasi-oversold conditions – what I will now sometimes colloquially call “over-stretched” to make my post titles sound less technical and hopefully more inviting. T2108 has dropped into quasi-oversold conditions for the second straight day. With a 34% 2-day loss and the VIX soaring by 15%, the T2108 Trading Model (TTM) is predicting another down day with 70% odds again. The associated decision (regression) tree is basing the entire prediction on the 1-day decline of T2108 of 18%. The guidance from the last T2108 Update holds again: operate as though the S&P 500 will close the day in the red, but be prepared to jump if the market responds to any positive catalyst. After all, 30% and lower has often been “low enough” to form a (trading) bottom.
The catalyst to cause a jump may not be an influential analyst or journalist this time. It may simply be 50-day moving average (DMA) support.


An odd aspect of the current rush to true oversold conditions is that the major indices are NOT experiencing anything close to a major, steep, uncomfortable, or even swift sell-off. There is little here that says sentiment has become overly negative. This explains why I am not comfortable getting ready to aggressively buy call options on ProShares Ultra S&P500 (SSO) for example.
I CAN say that many individual stocks are experiencing some swells in selling. T2108’s 26% is a near 6-week low. T2107, the percentage of stocks trading above their respective 200DMAs, has plunged further to 48%, a level last seen February 7th as the market began to recover from the early year sell-off. So, it is very possible that when (if?) the time to buy on oversold conditions comes, it will be best to pick over a list of choice individual stocks.
While these technical conditions are not conducive to an aggressive buy recommendation, they are also a possible trap for overly aggressive bears. For example, a very classic form of whiplash could feature a breakdown below 50DMAs on the major indices that bears chase downward. They will lick their chops assuming a top is confirmed with more selling to follow. If T2108 is oversold and T2107 is matching lows from earlier this year at the same time…well, you get the picture hopefully…the spring could pop at any time from there to catch sellers flat-footed. Ironically, more cautious bears may get the worst whiplash if they wait for a confirmation of the breakdown and find themselves opening fresh shorts just as T2108 sinks ever deeper into oversold territory.
Oh, and I did mention that the market is overdue for some kind of seasonal drawdown?
In other words, shorter-term traders have a VERY tricky playing field ahead. Neither bear nor bull will likely be allowed to get comfortable. (These are OK conditions for playing both sides of the fence as I have done. For an example, see my summary of trades from the last T2108 Update.)
I conclude with a look at two other key indicators that I follow when trying to sort through a confluence of trading signals: Caterpillar (CAT) – my favorite market hedge; and the Australian dollar (FXA), particularly versus the Japanese yen.
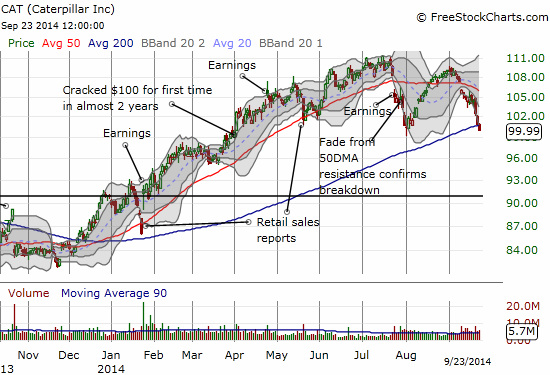
Caterpillar made a very bearish break below its 200DMA and failed to maintain a (meek) bounce off $100. Again, I sold my last round of CAT puts last week. I am ready to fade the next rally here. This is the lowest close since April 1st. Note in the chart below the very weak and unconvincing breakout above the 50DMA in August. The subsequent lower high and rounded dome is a CLASSIC setup for shorting.

The Australian dollar versus the Japanese yen (AUD/JPY) has been a relatively reliable indicator this year for bear/bull trading conditions. AUD/JPY is still in bullish breakout territory first established in early April and re-established with the breakout to new highs a month ago. The Australian dollar has been so weak this month that not even a strong bout of weakness in the Japanese yen has saved AUD/JPY from a sharp and abrupt fall from its previous uptrend. AUD/JPY has confirmed that upward momentum in risk attitudes has likely come to an end, but it has not yet given the green light to bears either. Such a confirmation will need to wait for a breakdown below the 200DMA…a key support which held very nicely in May and August.

Overall, bears and bulls alike – brace yourselves!
Daily T2108 vs the S&P 500

Black line: T2108 (measured on the right); Green line: S&P 500 (for comparative purposes)
Red line: T2108 Overbought (70%); Blue line: T2108 Oversold (20%)
Weekly T2108

*All charts created using freestockcharts.com unless otherwise stated
The T2108 Resource Page
Expanded daily chart of T2108 versus the S&P 500
Expanded weekly chart of T2108
Be careful out there!
Full disclosure: net short Australian dollar
