
(T2108 measures the percentage of stocks trading above their respective 40-day moving averages [DMAs]. It helps to identify extremes in market sentiment that are likely to reverse. To learn more about it, see my T2108 Resource Page. You can follow real-time T2108 commentary on twitter using the #T2108 hashtag. T2108-related trades and other trades are posted on twitter using the #120trade hashtag)
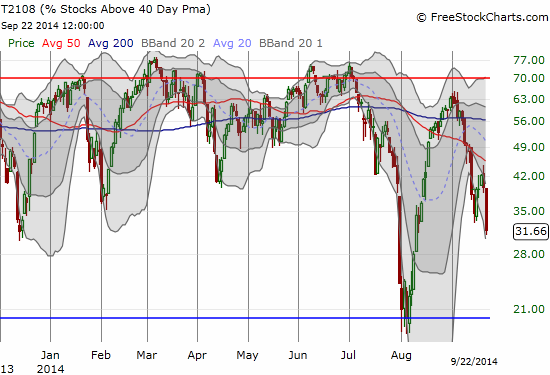
T2108 Status: 31.7%
VIX Status: 13.7%
General (Short-term) Trading Call: Hold (TRADERS REMAIN READY FOR WIDE SWINGS)
Active T2108 periods: Day #313 over 20% (includes day #280 at 20.01%), Day #29 over 30%, Day #6 under 40% (underperiod), Day #9 under 50%, Day #11 under 60%, Day #53 under 70%
Reference Charts (click for view of last 6 months from Stockcharts.com):
S&P 500 or SPY
SDS (ProShares UltraShort S&P500)
U.S. Dollar Index (volatility index)
EEM (iShares MSCI Emerging Markets)
VIX (volatility index)
VXX (iPath S&P 500 VIX Short-Term Futures ETN)
EWG (iShares MSCI Germany Index Fund)
CAT (Caterpillar).
Commentary
Another Fed-inspired pop is long forgotten again.
T2108 closed at 31.7%, a level last seen in mid-August. The 2-day loss of 24.9% qualifies for quasi-oversold conditions. The T2108 Trading Model (TTM) estimates 70% odds of further downside to follow Monday’s selling. The classification error is a very high 46% (10x cross-validation); the error rate when fit just to history is about 30%. The lesson from the last quasi-oversold episode is to operate as though the S&P 500 (SPY) will close down but to recognize that the market is stretched and a simple positive catalyst could send it lurching higher. For example, the TTM cannot anticipate the catalyst we saw last week: a journalist talking Happy Fed talk that the market uses as an excuse for buying. T2107, the percentage of stocks trading above their 200DMA further underlines the quasi-oversold condition. T2107 has quickly plunged to 51.3%, a level last seen in February!
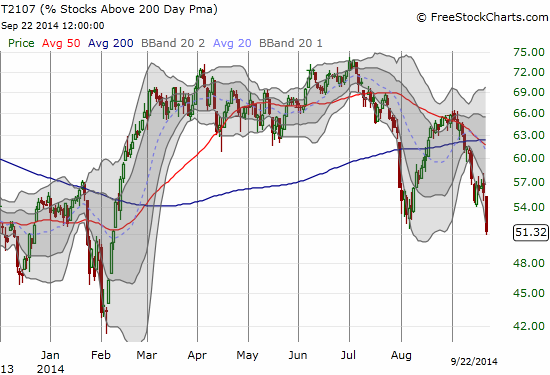
I do not have a formal model for interpreting extremes in T2107. Since the August lows occurred at similar T2107 levels, traders should stay on alert that the market could bounce sharply at ANY time. For a mental model, think about the psychology of buyers and folks eager to participate in the market. They are looking at their favorite stocks falling very fast to or through key price and other technical levels. In many cases, they missed buying the last time their favorite trades reached this level. Punches through the 200DMA can look particularly over-extended to folks looking for a buying excuse. So, when an influential voice flips the right switch, the party gets started.
For the rest of us, we need to stay calm and remain VERY circumspect. A bearish chill is still descending upon the market in my opinion. I have a HOLD for the trading call only because no key technical level has broken to justify telling longs to stop out and/or lock profits. I also see a few pullbacks that indeed look worth the risk to justify a quick trade. Make no mistake though, but the S&P 500 (SPY) and the NASDAQ (QQQ) are still looking toppy.
The S&P 500 printed a fresh all-time high after the Federal Reserve announced its latest monetary policy decision. It was yet another no-news event that the main media insisted on turning into a moment of financial drama. This print may turn into a false breakout given it was followed by a moment of indecision: a candlestick doji called an evening star. Monday’s selling confirmed the bearish interpretation of this potential sign of the end of the uptrend and thus a topping pattern.
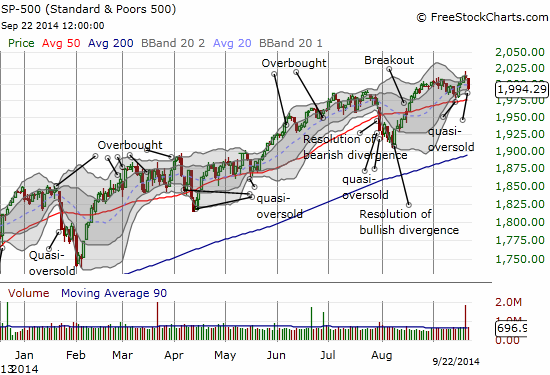
Regular readers should also notice that Friday created a kind of divergence given T2108 definitively declined even as the S&P 500 remained flat. It was another divergence that signaled a big move the next day.
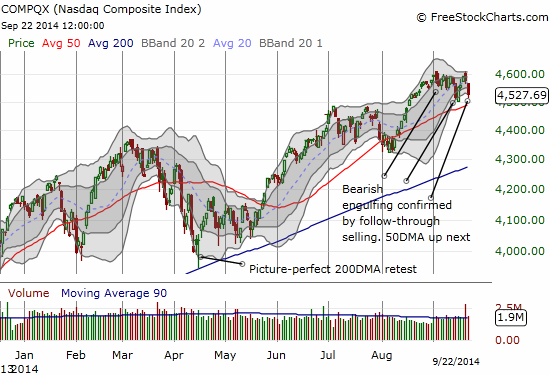
The NASDAQ (QQQ) is still in worse shape than the S&P 500. The NASDAQ not only failed to make a new high last week, but also it is STILL struggling to invalidate the bearish engulfing topping pattern from September 3rd.
The volatility index, the VIX, naturally jumped on today’s selling. It just happened to gap up from a retest of August’s lows. This move once again verifies that the ever so slight bias of volatility is now to increase NOT decrease (are central banks across the planet starting to breathe sighs of relief?!?)
Finally, as you can imagine, the swift trading has created some very important and even enticing stock chart patterns. I do not have the time to post these charts, so I will trust interested readers to look these up on your own. Some of the stocks in this list are also follow-ups to trades I have proposed in previous posts.
- iShares MSCI Emerging Markets (EEM): gap down of -1.5% confirmed 50DMA breakdown. Sold latest round of puts. I will continue to fade EEM rallies at key points of resistance.
- iShares MSCI Turkey (TUR): Broke its 200DMA on Friday. With the Turkish lira (USD/TRY) losing out to the U.S. dollar, I moved quickly to buy puts on TUR. I may get more aggressive on USD/TRY longs.
- SolarCity Corporation (SCTY): Confirmed breakdown of 200DMA and a topping pattern I pointed out on September 15. A complete reversal of the June 17 surge is now in play. I locked in profits and sold my put options. This one is good to fade on rallies to ressitance.
- Zillow (Z): I screwed up last week trying to hold on for more profits from the decline and ended up empty-handed! I should have just shorted the stock instead of buying puts. Shares are hard to borrow though. I bought a small number of shares as a play on Z’s tendency to surge for no apparent reason immediately following active selling.
- Rio Tinto plc (RIO): Gapped down and confirmed bearish developments I wrote about earlier. See “Warning Signs: A Sharp Rush Away From The Australian Dollar And Related Trades” for a follow-up. I am holding onto my January puts as I anticipate a LOT more selling in the coming weeks or months.
- Monster Beverage Corporation (MNST): My timing was off and I had to sell my call options at a loss last week. I somehow neglected to make sure a fresh order on Friday executed. Sure enough, an upgrade on Monday sent the stock up 2.9% on a bout of impressive relative strength and a new 1-month high. As a good friend noted, the current plunge in commodity prices will help beverage companies like MNST.
- Caterpillar Inc. (CAT): I sold my puts last week for a nice profit but wish I had bought longer-dated put options. On Monday, CAT fell another 1.6% to stop just short of hitting its 200DMA, my downside bearish target. A break of this level will sound the bearish alarm bells VERY loudly. I like continuing to fade CAT on bounces.
- Rackspace Hosting, Inc. (RAX): I was VERY fortunate to have a stop in place for my previous tranche of call options. I was taken out when RAX punched below $38 briefly. I was not happy until last Wednesday’s fresh collapse on news that RAX had given up looking for a buyer. I moved into fresh, long-dated call options. This is pure speculation now because a catalyst to regain lost ground is much less clear now. A market sell-off will undoubtedly take RAX even lower.
- Baidu (BIDU): This trade was my best one of last week. BIDU popped on cue after a 50DMA retest. I sold out a little early, but I was nonetheless happy. I was VERY tempted to dive right back in on Monday’s retest of the 50DMA on a 4.5% plunge. I decided to be a bit more patient this time since one could easily argue BIDU is starting to look like it is making a triple top. Gulp!
- ProShares Ultra VIX Short-Term Futures (UVXY): Once again, the Fed successfully worked to depress volatility. Shortly after last week’s monetary policy announcement and press conference, I sold my UVXY puts. The main losses on UVXY occurred the day before when the market “celebrated” the notion that the phrase “considerable time” would remain in the Fed’s lexicon.
I think readers can tell from my trades which stock market beast currently has the strongest grip on my heart and mind even as I reserve some mettle for very select bullish plays…
Daily T2108 vs the S&P 500
")
Black line: T2108 (measured on the right); Green line: S&P 500 (for comparative purposes)
Red line: T2108 Overbought (70%); Blue line: T2108 Oversold (20%)
Weekly T2108

*All charts created using freestockcharts.com unless otherwise stated
The T2108 Resource Page
Expanded daily chart of T2108 versus the S&P 500
Expanded weekly chart of T2108
Be careful out there!
Full disclosure: net short Australian dollar, long TUR put options, long MNST call options, long RIO put options, long Z, long USD/TRY