
(T2108 measures the percentage of stocks trading above their respective 40-day moving averages [DMAs]. It helps to identify extremes in market sentiment that are likely to reverse. To learn more about it, see my T2108 Resource Page. You can follow real-time T2108 commentary on twitter using the #T2108 hashtag. T2108-related trades and other trades are posted on twitter using the #120trade hashtag)
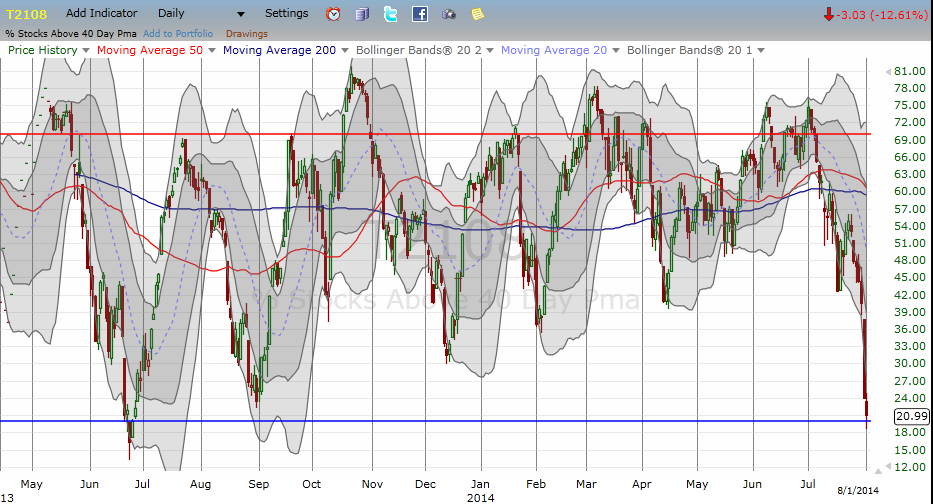
T2108 Status: 21.0% (broke to oversold intraday, as low as 18.6%)
VIX Status: 17.0
General (Short-term) Trading Call: Selective buying for short-term trades. Fade rallies, preferably at or near resistance. Nuances explained below.
Active T2108 periods: Day #270 over 20%, Day #2 under 30% and 40% (underperiods), Day #6 under 50%, Day #17 under 60%, Day #20 under 70%
Reference Charts (click for view of last 6 months from Stockcharts.com):
S&P 500 or SPY
SDS (ProShares UltraShort S&P500)
U.S. Dollar Index (volatility index)
EEM (iShares MSCI Emerging Markets)
VIX (volatility index)
VXX (iPath S&P 500 VIX Short-Term Futures ETN)
EWG (iShares MSCI Germany Index Fund)
CAT (Caterpillar).
Commentary
The odds were with the bulls on Friday, but buyers could not quite pull off a closing victory on the S&P 500 (SPY). The end result is a trading and technical environment that is getting ever more complicated. This edition of the T2108 Update includes a swirl of bullish and bearish signs. However, note that after Friday’s close my downgrade of the fundamental technical health of the market remains at a “poor” rating. This downgrade influenced my interpretation of the market’s open on Friday, August 1st. My last T2108 Update will be important context for my trading until the S&P 500 does something definitively bullish like close above its 50DMA.
The open of trading is exactly what I did NOT want to see. There was no gap up or down, the market just dribbled out of the gate and gently churned about for the first 80 minutes or so. What I wanted was something definitive – particularly a gap down that cleared out weaker hands and trapped overly aggressive bears – that would set up a definitive surge out of oversold conditions.
During this churn, UVXY traded straight down. Without a bullish open, I decided to play the bearish side with a small purchase in UVXY shares and a limit order two points higher to lock in profits. It was a fortuitous purchase as UVXY bounced perfectly off its consolidation window (see the last T2108 Update for an explanation). I greatly under-estimated the subsequent bounce in UVXY.

The peak in UVXY perfectly coincided with an end to T2108’s drop for the day, a drop that placed T2108 into oversold territory. This trigger was the day’s most important trading development. It happened as sellers stretched the S&P 500 further below its lower-Bollinger Band, perfect conditions for a bounce. I immediately went into aggressive trading mode and added to my ProShares Ultra S&P500 (SSO) call options. However, I did not double down on my ProShares Ultra VIX Short-Term Futures (UVXY) put options as they did not decline enough to warrant more purchases. I am assuming this apparent increase in implied volatility suggests the odds of a fresh collapse in UVXY have increased.
Click image for a larger view…
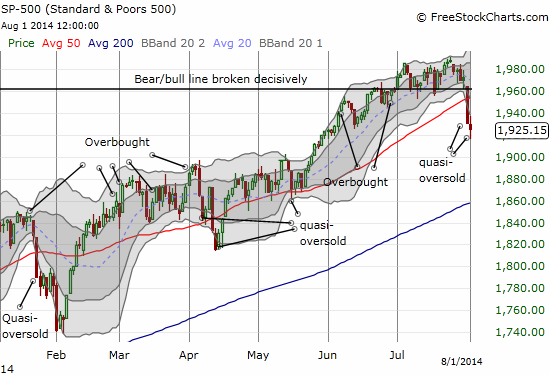
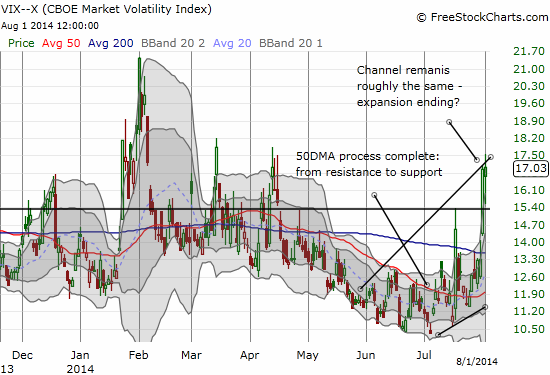
The S&P 500’s failure to close with a gain rendered Thursday’s prediction from the T2108 Trading Model (TTM) incorrect. While T2108 did not close in oversold territory, it is still in quasi-oversold mode with a 12.6% decline on Friday and a 2-day decline of 48.1%. THIS time, the TTM is predicting more downside for Monday. The historical odds are 71% with a downside classification error around 35% (pretty high). The entire model (regression tree) this time hinges on the change in the VIX. If the VIX had increased by at least 8.1%, the odds of a bounce would have been 84%. In other words, the best bullish opportunities going forward will continue to be when sellers over-extend themselves: T2108 oversold, a surge in the VIX, and/or the S&P 500 trading well below its lower-Bollinger Band.
The chart above of the S&P 500 reminds me of the sloppiness possible in bounces from quasi-oversold conditions. So, I plan to exercise patience and persistence in playing the next bounce with an eye to trade UVXY as I did today to pay for the SSO call options.
These trades and setups are prime examples of the more complicated trading environment. Accordingly, Friday delivered a healthy mix of bullish and bearish opportunities in individual stocks. I provide examples below of Apple (AAPL), LinkedIn (LNKD), and Yelp.com (YELP). I also duly noted that the latest IPO craze El Pollo Loco Holdings, Inc. (LOCO) managed to gain another 6.3% to print a fresh post-IPO high. Friday’s big IPO was MOBILEYE N.V. (MBLY): it printed a first-day pop of 48% from its IPO price.
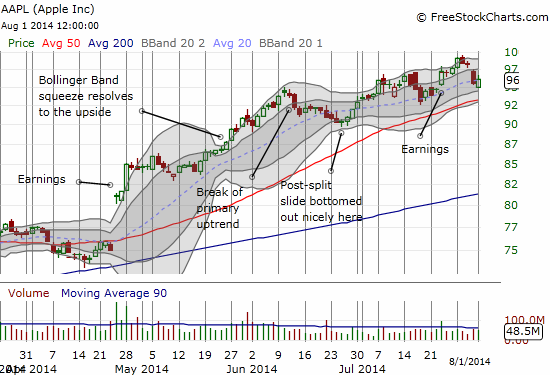
Apple (AAPL)
Apple continues to make the predicted Friday sell-off a more dicey trade. This Friday it gapped down and then led the post-oversold rally. It even managed to close with a marginal gain. I failed in an attempt to fade the pop, but I am now positioned for the typical Monday pop. Note well that AAPL has now successfully reversed all its post-earnings gains while leaving the primary uptrend from the 20DMA (and then the 50DMA) intact. (See “Apple Trading Model – Preparing for A Potential Change In Trading Patterns” for the last update to the Apple Trading Model and links to the classification trees that represent the odds of upside on a daily basis).
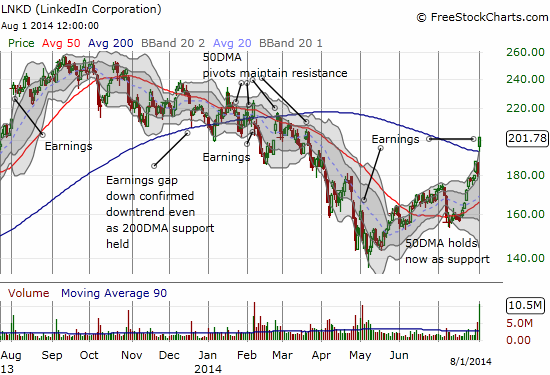
LinkedIn (LNKD)
Regular readers may recall my many posts on LNKD. In May, I finally stopped playing puts against my shares. I had planned on continuing to hold shares through LNKD’s earnings as I expected a bullish pop like Twitter (TWTR). I was all set until market conditions took their bearish turn on Thursday. I sold my shares quickly after the open on Thursday and felt relieved with profits safely placed in the bank. Of course, now I feel some seller’s remorse, but I have no regrets as I made what I thought was the better risk/reward move. LNKD’s post-earnings pop is about as bullish as they come. I daresay this is a buy on the dips no matter what the general market is doing in the coming weeks. A “gentle” retest of the 200DMA as support would be a gift…
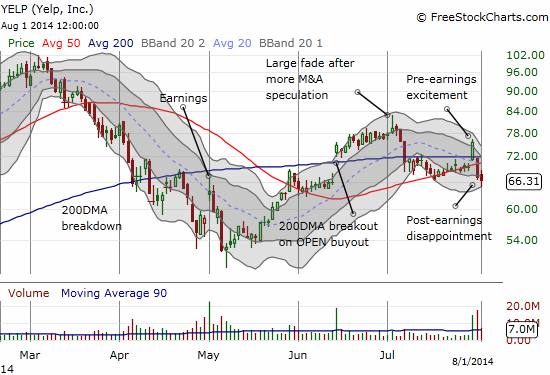
Yelp.com (YELP)
I have also made several posts on Yelp.com. In the last one I noted that “a close below the 50DMA gets me back to beartown on this one.” The close below the 50DMA on July 17th was marginal and did not trigger a trade. The post-earnings collapse below the 50DMA DID get my attention. It was a quadruple-bonus: post-earnings, high-volume selling, a gap down that trapped over-eager pre-earnings buyers, AND a bunch of analyst upgrades and increased price targets that did not put an end to the selling. So on Friday I was ready to go bearish on YELP with put options when YELP put on a feeble rally from the open (I dare not EVER short the shares given the on-going and looming specter of potential M&A rumors). I sold and locked in profits after T2108 went oversold. As a reminder, the trading rules for oversold include instructions to AT LEAST start closing out short positions.
There are many other stories I can tell but too little time. Interested traders who keep alert with radar fully energized will maintain the edge over others who still think the summer is a time for languid trading…
Daily T2108 vs the S&P 500
")
Black line: T2108 (measured on the right); Green line: S&P 500 (for comparative purposes)
Red line: T2108 Overbought (70%); Blue line: T2108 Oversold (20%)
Weekly T2108

*All charts created using freestockcharts.com unless otherwise stated
Related links:
The T2108 Resource Page
Expanded daily chart of T2108 versus the S&P 500
Expanded weekly chart of T2108
Be careful out there!
Full disclosure: long UVXY puts, long SSO call options, long CAT shares