
Trading in Apple is likely to make a notable change in the coming weeks and months.
The Apple Worldwide Developers Conference (WWDC) begins June 2nd. According to my analysis of trading around the WWDC since 2000, traders treat this event as a “buy the rumor, sell the news” kind of event (see “Buy The Rumor, Sell The News: The Case Of Apple’s Worldwide Developers Conference“). The fade on Friday seemed to signal just such a “sell the news” kind of week.
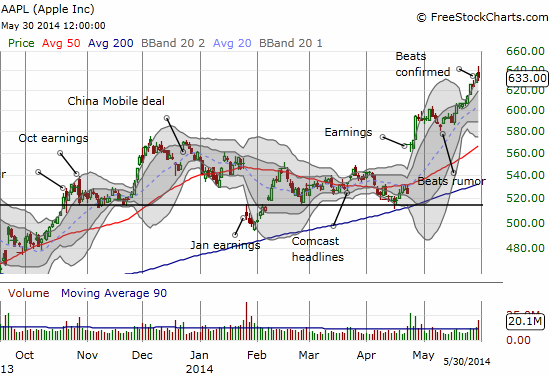
Source: FreeStockCharts.com
Apple traded as high as $644.17 on Friday, May 30 only to fade as low as $628.90 before rebounding sharply to close at $633.00. This wide range surely caused a lot of triumph and tears in the trading of options expiring that day. It likely also further hiked up already expensive premiums for options trading during the week of WWDC. Options sellers are likely salivating at the opportunity.
The weekly April $650 call expiring on June 6th gives a great example of the expense of these options. At the time of writing the weekly AAPL option expiring on Friday, June 6th, at the $650 strike costs $2.85/$3.00. The implied volatility is 27.4% while the historical volatility is roughly half that at 13.7%. A simple drop to historical volatility renders the call option essentially worthless at $0.32. I expect volatility to take a steep dive after the first day, perhaps immediately after the keynote address. Such prospects make it extremely difficult to operate the Apple Trading Model (ATM).
The coming split in Apple stock is also motivating me to give the ATM a rest this week. The 7-to-1 split promises to increase demand for the stock by retail investors. I am assuming this demand will directly migrate from the options pit and into the stock. I think it SHOULD provide upward pressure on the stock, but I also suspect bigger traders are waiting to fade such demand. Regardless, the shift in trading from options to stock could/should have a notable impact on day-to-day trading patterns. If so, then the ATM will experience higher than normal classification errors. I hope not, but I am preparing for the possibilities.
With all these changes in mind, I am staring down the barrel of a potential end of an era. So, I am giving the ATM a fresh turn of the crank and posting the latest decision trees. I am preparing for creating a fresh break in the historical data analysis that will break 2014 into pre/post June 1st. Currently, the only breaks are by year. For those new to the Apple Trading Model, please refer to past posts to get an understanding of how it works: in particular “ATM: The Apple Trading Model Refined.” While I regularly post updates of the decision trees, on my last reminders of such chart updates was in November, 2013 in “Apple Trading Model Refined: Squeeze Resolves Into A Breakout (Includes More Lessons for Execution).”
Here are links to the charts of the decision trees listed by the first year of historical data used in the model:
Trade from the previous close
2010
2011
2012
2013
2014
Trade from the open (intraday)
2010
2011
2012
2013
2014
Here is an example of why I am inclined to give ATM a rest during the week of WWDC…the ATM predicts an 85 to 88% chance of an up close on Monday. Typically, Apple experiences strong Mondays. Yet, the history on WWDC gives high odds to losses on Monday, the first day of the conference. The ATM simply cannot account for a specialized event like WWDC. Note however that if AAPL dips “enough”, say over 1.5%, I will step up to buy some call options in the expectation of a bounce. The ATM predicts a 25 to 29% chance of AAPL closing above its open, so I cannot get too aggressive on such a trade.
I am also calling this a potential end of an era because on Friday I actually and finally sold my small amount shares in Apple (=gasp=!). I saw the beginning of what looked like the fade the ATM predicted for the day, and I sold. I wish I had been angling to make a fresh options trade as well!
Anyway, those shares served as a core position for quite a long time. I am glad I did not sell when my intuition told me to sell at $600. Instead, I decided to hold after concluding from a sentiment analysis that Apple is heading back its all-time highs in due time.
So why sell if I still project a return to all-time highs? It is all about risk management and a desire to lock in a good profit (the anti-greed rule). I figured given the run-up into the coming week’s of events, it made sense to lock in my profits here. Moreover, AAPL has a VERY common habit of cooling off significantly after tagging the upper-Bollinger Band (BB) as it has done now. Indeed, this is common behavior for stocks in general. If you read my T2108 Updates, you then also know that I am increasingly wary of the apparent deepening complacency in the market with volatility dropping to extreme lows at a very precarious time for the market. For more background and a different angle leading to the same conclusion, you can also read “Calm Before The Storm” by Seeking Alpha contributor and friend John Gilluly.
Note very well I have NOT turned bearish on AAPL. I will treat the next notable dip in AAPL as a unique buying opportunity to re-establish a position. Like many retail investors and traders, I even look forward to buying seven times as many shares as I normally could have… 🙂
Be careful out there!
Full disclosure: no positions