(T2108 measures the percentage of stocks trading above their respective 40-day moving averages [DMAs]. It helps to identify extremes in market sentiment that are likely to reverse. To learn more about it, see my T2108 Resource Page. You can follow real-time T2108 commentary on twitter using the #T2108 hashtag. T2108-related trades and other trades are posted on twitter using the #120trade hashtag)
T2108 Status: 21.0% (broke to oversold intraday for second day in a row, as low as 19.1%)
VIX Status: 15.1
General (Short-term) Trading Call: Selective buying for short-term trades. Fade rallies, preferably at or near resistance. Nuances explained in past two T2108 Updates.
Active T2108 periods: Day #271 over 20%, Day #3 under 30% and 40% (underperiods), Day #7 under 50%, Day #18 under 60%, Day #21 under 70%
Reference Charts (click for view of last 6 months from Stockcharts.com):
S&P 500 or SPY
SDS (ProShares UltraShort S&P500)
U.S. Dollar Index (volatility index)
EEM (iShares MSCI Emerging Markets)
VIX (volatility index)
VXX (iPath S&P 500 VIX Short-Term Futures ETN)
EWG (iShares MSCI Germany Index Fund)
CAT (Caterpillar).
Commentary
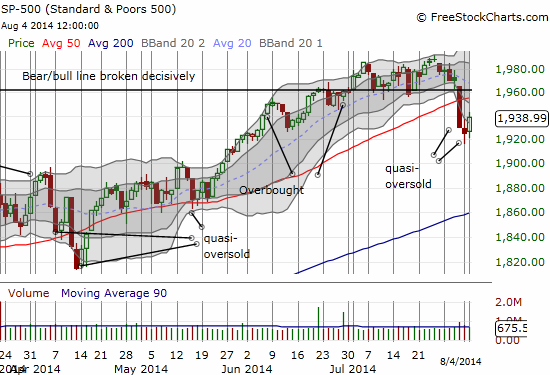
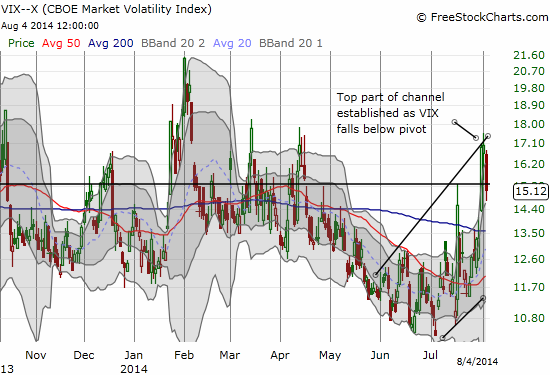
For the second day in a row, T2108 dropped into oversold territory only to bounce back without closing oversold. This time around, the bounce was healthier by every dimension: the S&P 500 closed with a 0.7% gain, T2108 surged 16% higher, and volatility was smashed hard enough to dive under the 15.35 pivot line. (By the way, I continue to be amazed at how well this line works as a pivot point!).


While the first quasi-oversold condition did not precede a gain for the S&P 500, the second did. I will update the T2108 Trading Model (TTM) with these new data points. This episode is still a lesson for over-eager bears that chase over-extended selling downward. The chances of a retest of the 50DMA (as resistance this time) just increased by some amount.
However, bulls should not uncork the champagne to shout “bottom!” just yet. The test at resistance will likely be tough. More importantly, the apparent bottoming in volatility opens up higher odds of deep sell-offs at any time. The channel shown above even suggests we should expect HIGHER volatility over time. (I should soon have a piece on Seeking Alpha published examining the technical implications of the loss in July ahead of the S&P 500’s “most dangerous” months).
I also did not like the “lazy” way in which this quasi-oversold condition unfolded. There was no real washout event for sellers even though volume picked up a bit from the selling. There was no gap down no cause the weakest hands to shake loose and no gap up to trap over-eager bears. In other words, there were no clear, definitive trading bursts. This of course does not guarantee a bottom did or did not happen – just that my preferred scenario for a bottom did not come to pass. Otherwise, I would have been even more aggressive than I already was in buying ProShares Ultra S&P500 (SSO) call options and ProShares Ultra VIX Short-Term Futures (UVXY) put options.
For today’s trading action, I included last week’s script to ride UVXY puts on the house’s money. The plunge in the VIX sent UVXY tumbling 9.2% and as large a loss as 11% or so. I added to my UVXY shares even as I doubled down on my puts earlier. As a reminder, the point of the shares is to pay off the puts. It worked last week, and I am pressing my luck here again as I strongly suspect UVXY has at least one more good pop in its blood before resuming its typical downward spiral.
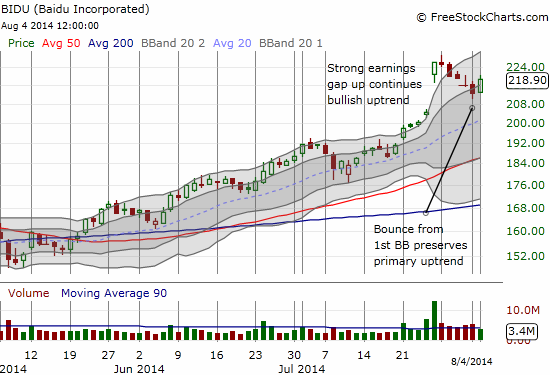
I also reloaded on Yelp.com (YELP) puts to fade another rally toward its 50DMA. On the bullish side, I made a play for Joy Global (JOY) (an article explaining this play should be on Seeking Alpha soon). The best trade of the day was a call spread on Baidu (BIDU). The stock has faded in orderly fashion since gapping up 11% post-earnings on Friday, July 25th. I have been eyeing the stock like a hawk for an entry. Quasi-oversold conditions combined with a pause on the first Bollinger Band (BB) generated a good risk/reward entry. I watched for the first sign of (buying) life in the stock and it came right from the open. Intraday volatility got me into the play at my limit price. This was fortunate because the stock continued to race upward from there. I was VERY tempted to close out the position and lock in profits, but instead I decided to hang in there and see whether BIDU can now resume its post-earnings momentum. The clock is on a 12-day timer (the spread allows me to worry a lot less about the erosion of time premium).

Note that all these trades remain very consistent with the current trading call. The growing complexity of the trading environment will make sticking to the rules more important than ever!
Daily T2108 vs the S&P 500

Black line: T2108 (measured on the right); Green line: S&P 500 (for comparative purposes)
Red line: T2108 Overbought (70%); Blue line: T2108 Oversold (20%)
Weekly T2108

*All charts created using freestockcharts.com unless otherwise stated
Related links:
The T2108 Resource Page
Expanded daily chart of T2108 versus the S&P 500
Expanded weekly chart of T2108
Be careful out there!
Full disclosure: long UVXY puts, long SSO call options, long CAT shares
