
(T2108 measures the percentage of stocks trading above their respective 40-day moving averages [DMAs]. It helps to identify extremes in market sentiment that are likely to reverse. To learn more about it, see my T2108 Resource Page. You can follow real-time T2108 commentary on twitter using the #T2108 hashtag. T2108-related trades and other trades are posted on twitter using the #120trade hashtag)
T2108 Status: 53.0%
VIX Status: 12.2
General (Short-term) Trading Call: Hold. See below.
Active T2108 periods: Day #262 over 20%, Day #114 over 40%, Day #3 over 50% (overperiod), Day #9 under 60% (underperiod), Day #12 under 70%
Reference Charts (click for view of last 6 months from Stockcharts.com):
S&P 500 or SPY
SDS (ProShares UltraShort S&P500)
U.S. Dollar Index (volatility index)
EEM (iShares MSCI Emerging Markets)
VIX (volatility index)
VXX (iPath S&P 500 VIX Short-Term Futures ETN)
EWG (iShares MSCI Germany Index Fund)
CAT (Caterpillar).
Commentary
The S&P 500 (SPY) pushed higher to a new (marginal) intra-day all-time high but failed to hold for a fresh all-time closing high. Regardless, the index confirmed it wants to maintain the bullish trend and critical support I pointed out in the last T2108 Update.
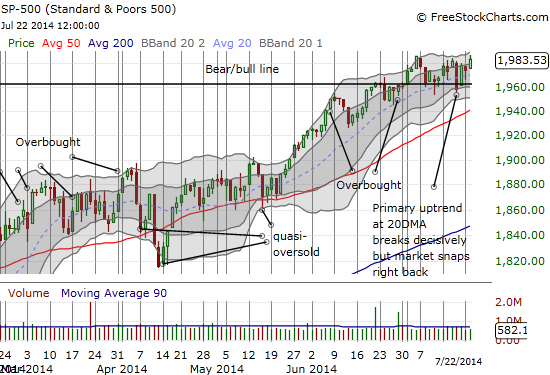
At these levels the index is once again working on the rare feat of entering the next overbought period at a HIGHER level than the last overbought period. T2108 closed at 53.0%, implying the market has plenty of upside potential for the next phase of trading (overbought triggers at 70%). Aggressive traders who still have shorts on the index should stop out after/if the S&P 500 closes at a fresh all-time high (the on-going churn is the price to pay for being aggressive).
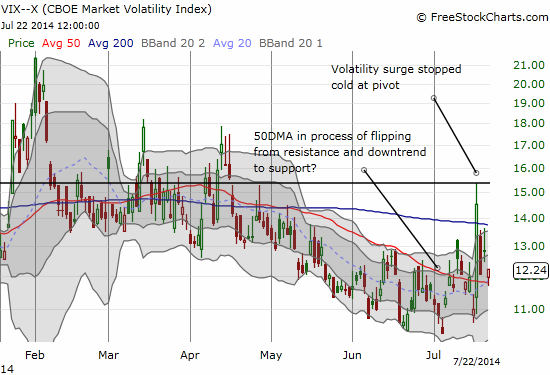
On the flip side, the VIX, the volatility index, is showing more hints of bottoming. I have been watching it ever more closely since last Thursday’s monster surge. Volatility faded as expected, but today I detected potential confirmation of a bottom as the 50DMA has held as support on the third post-surge day. Ever so slowly, the 50DMA is transforming from a downtrending cap on volatility to support.
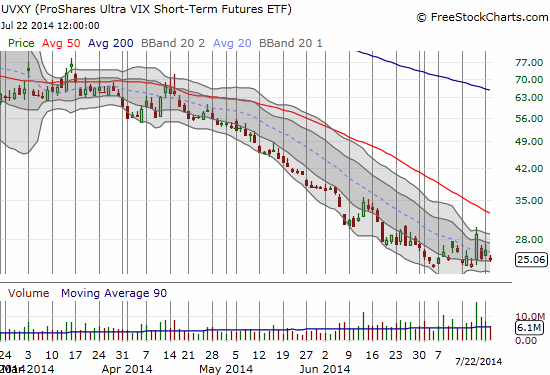
This observation motivated me to close out my put options on ProShares Ultra VIX Short-Term Futures (UVXY). Ironically, while I nailed the fade with a first tranche of puts at the high of UVXY on Thursday, the subsequent fade barely increased the value of the put. I braced myself for a reversal and sure enough Monday delivered. I stuck to plan and added another tranche of puts. Tuesday’s fresh decline got me impatiently anticipating a fresh swoosh lower. After a big swoon failed to materialize, I hurriedly closed out the position to preserve profits. The chart on UVXY is behaving a bit differently than earlier rendezvous with fresh all-time lows: it has built a small base for almost three weeks at its all-time low. UVXY is acting like it actually wants to put on a show up and to the right….
The implications of increasing volatility are many. While the S&P 500 can certainly continue increasing while the VIX trickles upward, we should expect the index to trade down at any moment volatility erupts to the upside. Volatility is so low now that the market implies there is little chance of a 10% correction (according to the Bank of England):
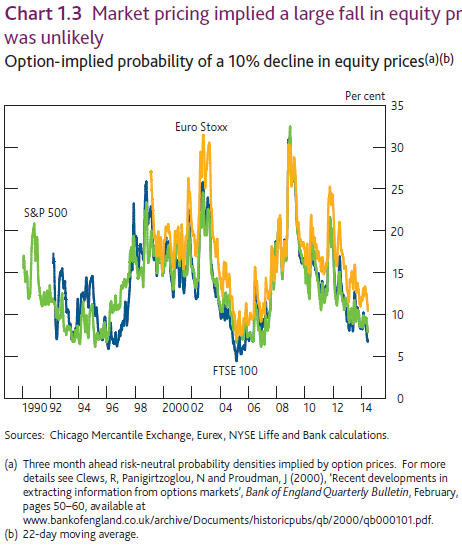
Notice how the odds of a big correction bottomed out 2 or 3 years before the big one finally hit.
The next two charts give homage to a potential bottom in volatility as they feature likely tops.
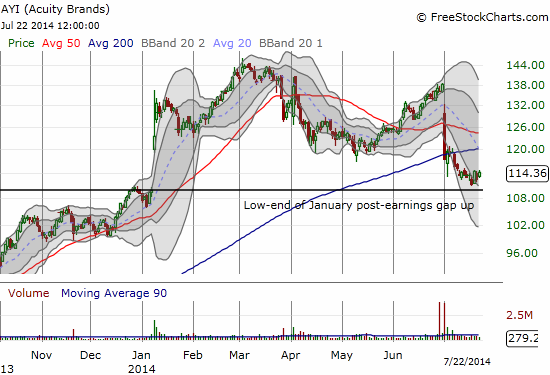
Acuity Brands, Inc. (AYI) is a cyclical company that provides lighting solutions mainly to commercial real estate. The stock broke down for a major post-earnings loss on July 1st. The trickle of selling since then has confirmed an important breakdown below the 200DMA. A gap fill should be around the corner for the next major test. A break below this support would be a major bearish event. Even if the stock rallies from here instead, it should meet stiff overhead resistance at the 50 and 200DMAs as a double-top now looms heavy on this stock.
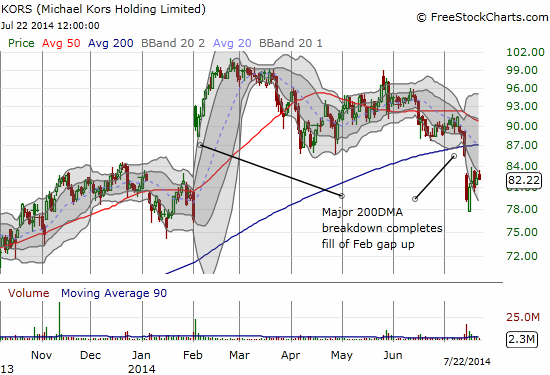
Michael Kors Holdings Limited (KORS) recently gave way under the weight of a slew of downgrades. The stock was already struggling to hold on after two breaks below 50DMA support. A high-volume plunge below the 200DMA flashed a major warning signal. Sure enough, the downgrades came the next day among a lot of downside fireworks. The stock plunged one more time the next day on a big gap down. As we observe so often, a stock rarely holds far below its lower-Bollinger Band for long. KORS snapped back like a rubberband and has churned ever since.
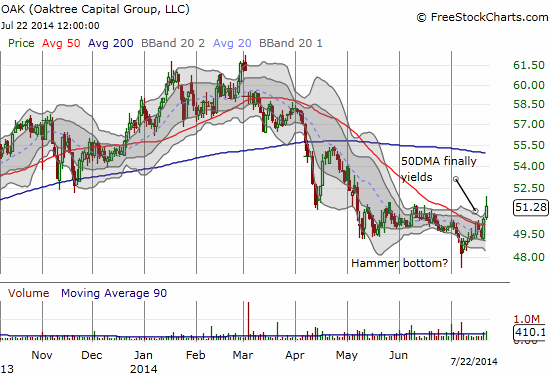
Now let’s swing over to a stock that might be bottoming after a series of under-performing months: Oaktree Capital Group, LLC (OAK). I have been eyeing this stock for a new buy point for a long time. Here is the description from Yahoo! Finance:
“Oaktree Capital Group, LLC operates as a global investment management firm that focuses on alternative markets. It manage investments in a number of strategies within six asset classes, including distressed debt; corporate debt, including high yield debt and senior loans; control investing; convertible securities; real estate; and listed equities. The company pursues these strategies through closed-end, open-end, and evergreen funds. Oaktree Capital Group, LLC was founded in 1995 and is headquartered in Los Angeles, California.”
With a 7.8% yield now, the stock is looking pretty juicy for a fresh purchase. It is of course the kind of “reach for yield” that has central banks across the globe increasingly complaining even as it is essentially their low-rate policies that both motivate and enable the reaching. OAK is full of special investments that are attractive in a low-rate environment. For example, the WSJ recently reported that OAK may be joining forces with Blackstone (BX) to purchase $8.84B in Spanish loans. (gulp!)
From a technical standpoint, OAK hit two important milestones. First, on July 8th it printed a hammer on high-volume. The buying off the lows continued and confirmed the bottom. This week buying volume picked up again to push OAK over pesky and persistent 50DMA resistance. This combination makes a very convincing case for a bottom.
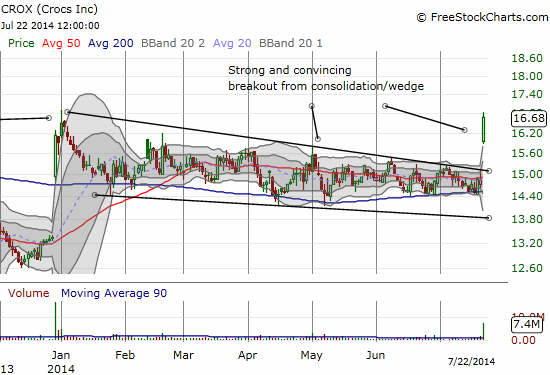
I conclude the chart reviews with a bullish chart that I promised to brich2day on StockTwits. This user wanted to understand my commentary on the post-earnings outburst on Crocs (CROX).
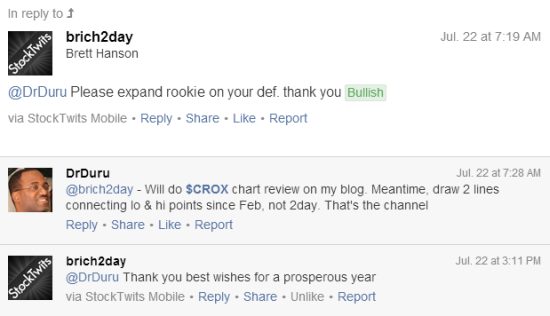
The chart below shows the neat consolidating channel that no longer has CROX trapped. Regular readers know I pointed out CROX as a buy after it surged to end 2013. Regular readers should also know that it is typically good to stay patient after such extensions well past an upper or lower Bollinger Band. Hard to believe I had to wait THIS long for the pay-off after I neatly entered a position as the 200DMA got tested. I promptly took profits with the stock so far above its upper-Bollinger Band (again, standard practice). I will be looking for another post-breakout fade for the next buying point.
Finally, a quick follow-up to the July pre-earnings trade for Apple (AAPL). I neglected to point out that IF AAPL closed for a gain ahead of earnings then the bullish signal would get muddied. I decided to respond to the move higher by putting in TWO orders, one for a call spread and another for a put spread. Neither triggered as the market refused to give me a good entry price (I really wanted to go long).
Doesn't look like market will give me my price on $ AAPL pre-earnings play. Will watch from sidelines. See prevous note for link to analysis
— Dr. Duru (@DrDuru) July 22, 2014
Sure enough, AAPL made a decent gain of 0.8% going into earnings. It dropped 0.5% in after-hours trading post-earnings. Essentially, the stock is fading the pre-earnings gains. As I stated in the earnings trading plan, I am firmly focused on buying a post-earnings dip (before switching back to using the Apple Trading Model). AAPL’s earnings were fine and did not change the fundamental bullish trading (or investing) thesis.
Daily T2108 vs the S&P 500
")
Black line: T2108 (measured on the right); Green line: S&P 500 (for comparative purposes)
Red line: T2108 Overbought (70%); Blue line: T2108 Oversold (20%)
Weekly T2108

*All charts created using freestockcharts.com unless otherwise stated
Related links:
The T2108 Resource Page
Expanded daily chart of T2108 versus the S&P 500
Expanded weekly chart of T2108
Be careful out there!
Full disclosure: long OAK