
It is earnings time for Apple (AAPL). Expectations are undoubtedly high after April’s huge post-earnings surge – the 8.2% one-day gain is, since 2007, second only to the 8.9% gain in April, 2012. The subsequent run-up certainly has me thinking AAPL has confirmed my expectations for eventual all-time highs. It is now time to temper expectations a bit, but the technicals and history are still on the side for another post-earnings gain. I was not able to update the Apple pre-earnings analysis ahead of April earnings, but hopefully regular readers were able to get what they needed from previous posts to know to go bullish in April.
First, a reminder that since 2007, AAPL tends to deliver a gain the day after reporting earnings: 18 of 30 (60%) of earnings have done so. However, only TWO of the last 8 earnings announcements have delivered positive gains. AAPL’s earnings “mettle” has clearly become tarnished.
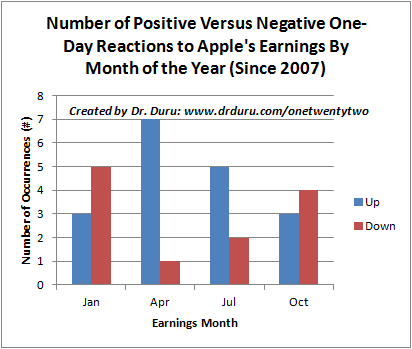
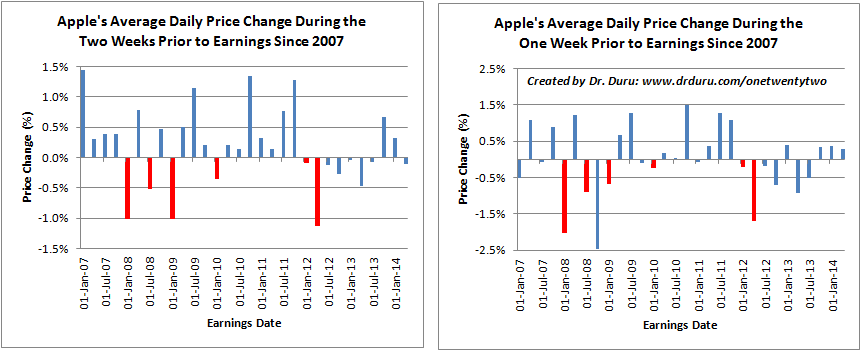
Note the strong bullishness of April earnings reports. I was fortunate enough to start this analysis before the April, 2012 earnings, and it gave me the confidence to continue this analysis. July is second to April in bullishness. The other two earnings seasons are actually net bearish.
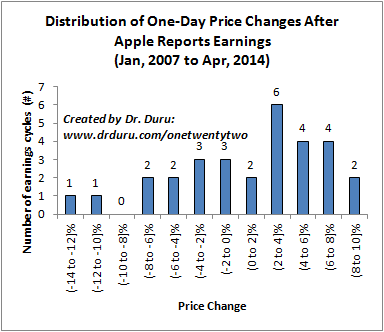
The distribution of post-earnings gains shows some real promise if a trader nails the direction correctly. However, despite the bullish bias in AAPL’s post-earnings behavior, the distribution skews toward large downside potential with a median price change of 2.5% while the average is only 1.0%. In other words, WHEN AAPL screws up, it tends to do so in a big way.
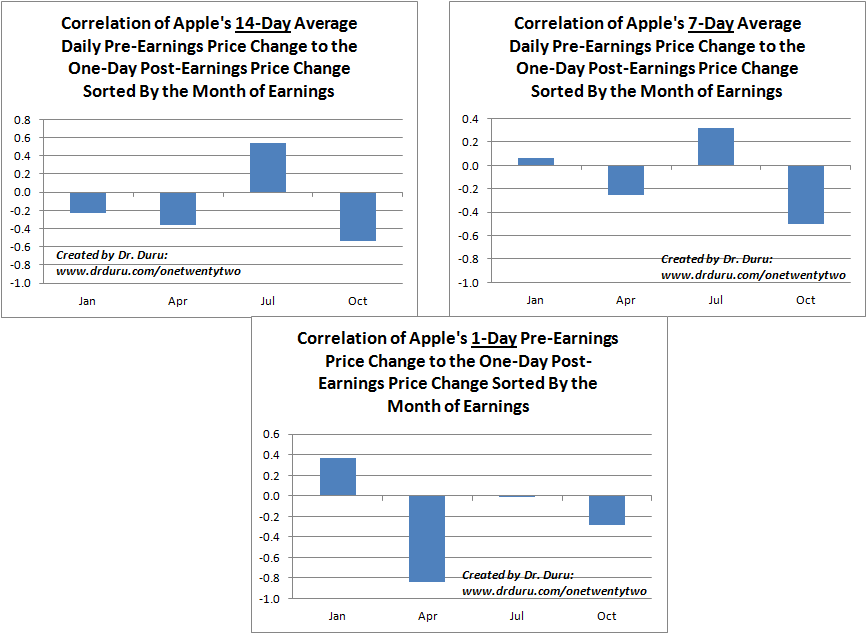
The most interesting correlations are those where actual trading provides indicators for future trading. In AAPL’s case, April is unfortunately the only earnings month where very clear and strong relationships exist. April has a strong inverse correlation between AAPL’s price change at the close before earnings and AAPL’s price change the day after earnings. Sure enough, this past April, AAPL traded down 1.3% just ahead of earnings – a notable move when the average change is only 0.1% and the median is 0.7%.
Click for a larger view…
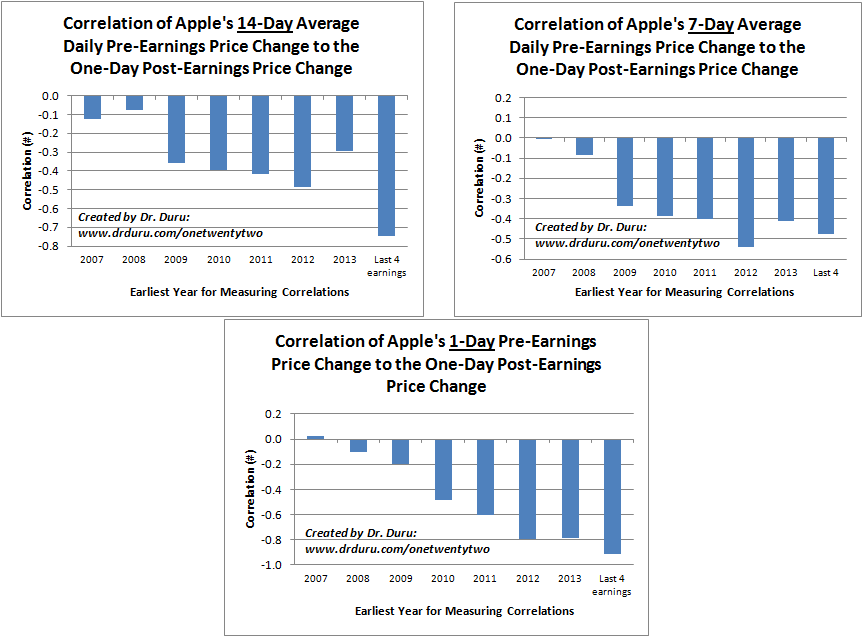
Removing the segmentation by earnings month, there is an increasingly strong (inverse) correlation between the price change at the close before earnings and the post-earnings 1-day price change. The last 4 earnings have delivered a nearly perfectly inversely correlated relationship. The last 4 earnings also stand out for a strong inverse relationship between the average price change in the 14-days prior to earnings and the post-earnings price change.
Click for a larger view…
Here are charts showing the time series of the average daily price changes for 7 and 14 days prior to earnings. As of Friday, July 18, AAPL was down an average 0.3% for the past 7 days and down an average 0.1% for the past 14 days. AAPL finished down 0.5% on Monday, thus nearly guaranteeing negative averages going into the close on July 22nd ahead of earnings – and adding a slight tip to the bulls for the day after earnings.
Click for a larger view…
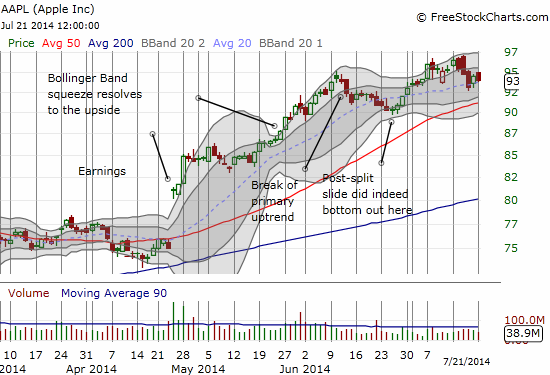
Source for graph: FreeStockCharts.com
So how to play the slight bullish bias? If you are only an investor, there is nothing to do except to sit back and watch the cows come home. 🙂 If you want to trade the post-earnings reaction, I recommend just conservative plays. I prefer call options. The market has already priced in about a 3% gain post-earnings for the call options expiring on Friday, so the bar is very high for making any money. A bullish call spread is the most effective way around these excessive premiums. If a trader targets a conservative 2% gain from Monday’s $94 close, this gives a $95.88 target. The $95/$96 call option costs about $0.40/per spread. So, this leave an opportunity to roughly double your money assuming an expiration at $95.80 or above. There are of course many potential configurations to suit your trading style and risk tolerance.
Another interesting play is to WAIT until after earnings. Assuming AAPL’s July earnings do not hurt the fundamental upward and bullish bias, any post-earnings dip is buyable. After earnings, I will return to playing the Apple Trading Model (ATM). I have updated the regression (decision) trees through Friday, July 18. You can access the links and an additional explanation in this article: “Apple Trading Model – Preparing for A Potential Change In Trading Patterns.” If AAPL sells off after July earnings, I will update an old analysis showing likely times to expect a post-earnings bottom for AAPL.
I am always interesting in hearing feedback on these modeling exercises. Good luck to all!
Be careful out there!
Full disclosure: long AAPL call option (note this is leftover from a failed play for a typical Monday pop in AAPL)
Thank you for all of this information. I have focused on the lows and the highs for turning points. What I had noticed since 2012 there are x amount of days between lows and highs.
Apple tends to peak in the second half of the month.
The next projected top for me is August 18th.
I did sell my Apple shares premarket at $97.80 on the IBM news.
That kind of analysis is exactly what I did some time ago to determine any between earnings trading patterns for lows and highs. Great stuff!
Addendum to other readers: IF AAPL closes up today (July 22) ahead of earnings, then the earnings trade gets much more murky. An up close today would add one bearish signal to two lukewarm bullish signals.