
(T2108 measures the percentage of stocks trading above their respective 40-day moving averages [DMAs]. It helps to identify extremes in market sentiment that are likely to reverse. To learn more about it, see my T2108 Resource Page. You can follow real-time T2108 commentary on twitter using the #T2108 hashtag. T2108-related trades and other trades are posted on twitter using the #120trade hashtag)
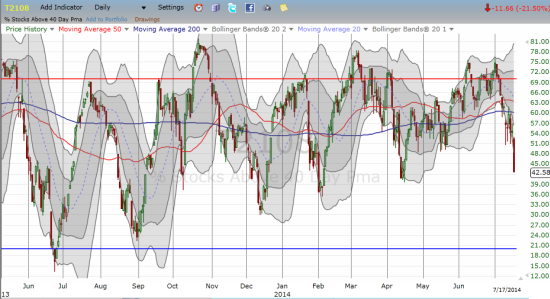
T2108 Status: 42.6%
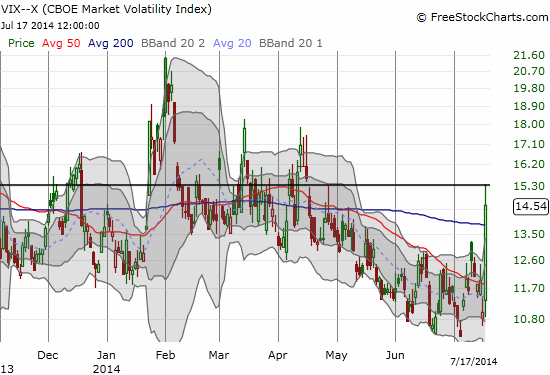
VIX Status: 14.5 (a 32% increase!)
General (Short-term) Trading Call: Should be stopped out S&P 500 longs. Aggressive traders can go bearish for wing trades until/unless T2108 returns to overbought territory. See below.
Active T2108 periods: Day #259 over 20%, Day #111 over 40% (overperiod), Day #1 under 50% (underperiod), Day #9 under 70%
Reference Charts (click for view of last 6 months from Stockcharts.com):
S&P 500 or SPY
SDS (ProShares UltraShort S&P500)
U.S. Dollar Index (volatility index)
EEM (iShares MSCI Emerging Markets)
VIX (volatility index)
VXX (iPath S&P 500 VIX Short-Term Futures ETN)
EWG (iShares MSCI Germany Index Fund)
CAT (Caterpillar).
Commentary
The S&P 500 (SPY) quickly went from a whiplash for the bears to a true retreat for the bulls.
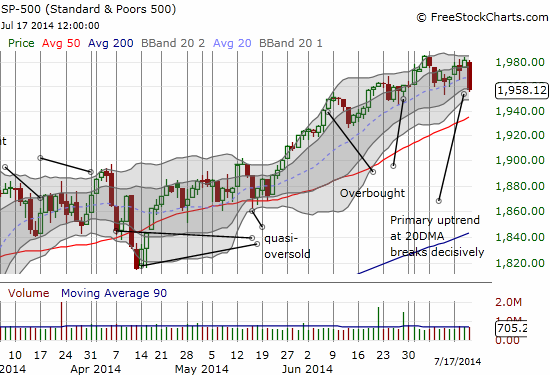
T2108 accompanied the market sell-off with a massive drop from 54.2% to 42.6%. The resulting -21.5% change in T2108 ranks #229 in size of NEGATIVE plunges since 1986. T2108 has had drops of similar magnitude on January 24 and February 3 of this year. So today’s action did not provide a sufficient signal that a sustained top is in the market. However, the close below the bear/bull line at 1962 on the S&P 500 qualifies to switch the trading call to bearish for the most aggressive traders (fades are of course ideal). Churn remains a huge risk, especially with earnings season in full swing, so bearish trades should be considered very short-term.
Another risk for bearish trades could be quasi-oversold conditions. These conditions occur after a 2-day decline of T2108 totaling at least 20%. Both days should feature “significant” declines (loose definition is on purpose). Typically, after such plunges, the S&P 500 experiences sharp reversals (upward). True oversold occurs when T2108 hits 20%, but we have not seen THOSE conditions in over a year! The 20% “overperiod” is now on day #259 and counting. T2108 will also be experiencing a critical test of the higher lows it has printed since oversold conditions in June. It is a bullish trend now suddenly hanging by a thread. I will consider a CLOSE below 39% on T2108 as a very bearish change in the fundamental underlying character of the market. That is, I will tend to “err” on the side of bearishness when signals are mixed.
The ostensible explanations for the market’s down day rest on negative geo-political headlines from Gaza and Israel and the tragic crash of a Malaysian airline in Ukraine. No one will be able to explain why THESE headlines are more important than all the other negative headlines the market has essentially ignored recently. All we really know is that the market is bullish until it’s not. Or perhaps the Federal Reserve’s posturing this week on valuations is playing with people’s heads…
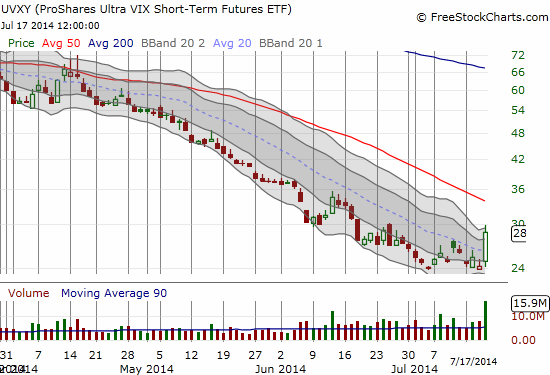
In the meantime, I faded ProShares Ultra VIX Short-Term Futures (UVXY) on principle: the VIX surged over 30%. Such a sudden and sharp intensification of fear does not last. The only question is how much higher it will go until it experiences the first fade. I will accumulate puts if the market serves them up at lower prices. Note that this trade does NOT come with a bullish or bearish call on the S&P 500. It is a call specifically on volatility that I think is more reliable than a directional bet on the S&P 500 here. The lower T2108 drops, the less sustainable such surges in volatility become. Stay tuned….
Daily T2108 vs the S&P 500
")
Black line: T2108 (measured on the right); Green line: S&P 500 (for comparative purposes)
Red line: T2108 Overbought (70%); Blue line: T2108 Oversold (20%)
Weekly T2108

*All charts created using freestockcharts.com unless otherwise stated
Related links:
The T2108 Resource Page
Expanded daily chart of T2108 versus the S&P 500
Expanded weekly chart of T2108
Be careful out there!
Full disclosure: long UVXY puts