
(T2108 measures the percentage of stocks trading above their respective 40-day moving averages [DMAs]. It helps to identify extremes in market sentiment that are likely to reverse. To learn more about it, see my T2108 Resource Page. You can follow real-time T2108 commentary on twitter using the #T2108 hashtag. T2108-related trades and other trades are posted on twitter using the #120trade hashtag)
T2108 Status: 51.3%
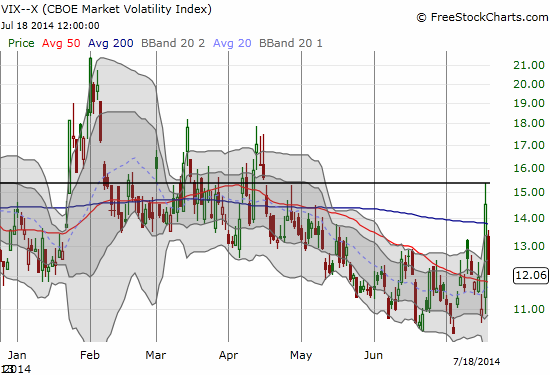
VIX Status: 12.1 (a 17.1% drop!)
General (Short-term) Trading Call: Hold. See below.
Active T2108 periods: Day #260 over 20%, Day #112 over 40%, Day #1 over 50% (overperiod), Day #7 under 60% (underperiod), Day #10 under 70%
Reference Charts (click for view of last 6 months from Stockcharts.com):
S&P 500 or SPY
SDS (ProShares UltraShort S&P500)
U.S. Dollar Index (volatility index)
EEM (iShares MSCI Emerging Markets)
VIX (volatility index)
VXX (iPath S&P 500 VIX Short-Term Futures ETN)
EWG (iShares MSCI Germany Index Fund)
CAT (Caterpillar).
Commentary
In the last T2108 Update, I managed to say all the right things to characterize the technical picture and the risks for bears and bulls. However, I managed to miss perhaps the most important signal which was what the forex (currency exchange) market was saying about Thursday’s sudden sell-off.
In “Forex Mainly Yawns As Stock Market Volatility Finally Surges Off Lows” I pointed out how the typical risk/fear plays did not manifest in the forex market in reaction to or in response to Thursday’s selling. Most importantly, AUD/JPY, the Australian dollar (FXA) and Japanese yen (FXY) currency pair, bounced back quickly before the U.S. market closed on Thursday. Well before it opened again, AUD/JPY had already started to trade HIGHER. The bottom-line was that Thursday’s selling did not have sufficient conditions for me to switch the trading call to an outright bearish one. Indeed, the snap back on Friday was almost as swift and vicious as Thursday’s plunge.
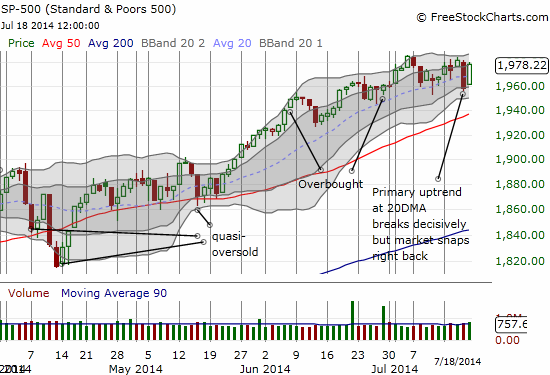
T2108 also surged nearly reversing all of Thursday’s losses. It closed the day at 51.3%. I was actually a bit disappointed the market did not deliver a gap down on Friday because it would have created clear quasi oversold conditions which would have finally triggered my purchase of call options on ProShares Ultra S&P500 (SSO).
The most important development for T2108 is that the pattern of higher lows from last year’s oversold conditions remains intact. This creates a VERY bullish case for aggressive traders to, yes (sorry!), churn again to look for opportunities to go long the S&P 500 (SPY). My choice for now remains to fade volatility, and I held onto my put options on ProShares Ultra VIX Short-Term Futures (UVXY).
I switched the trading call to hold to basically say that whether you are bearish or bullish, you have enough reasons to hold onto your positions if you did not already get stopped out: bears should stop out at fresh all-time highs (but likely will not given what the commentary I see from various bulls), bulls should stop out if Thursday’s lows get breached. In both cases, these triggers are for risk management (of losses). The risks of churn remain high although I think we are close to a new sustained trend, perhaps after the coming week of earnings.
The volatility index, the VIX, is the biggest source of caution for the bulls. While I think it will continue to fade this coming week, Thursday’s surge could very well FINALLY mark a bottom for the VIX. The S&P 500 can of course continue higher at higher levels of volatility, but higher volatility will likely mean buying dips rather than breakouts will remain the preferred way to get long. I may make ONE exception at the moment T2108 re-enters overbought territory.
I had a VERY interesting exchange on Saturday (July 19, 2014) on twitter with master “old school” technical trader Helene Meisler. She noted the impressive surge in breadth on the NYSE on Friday while another trader corrected her on the timeframe for the last time breadth was this good. I noted that when breadth was last this good it occurred during a time when it looked like the market was finally topping (I even went so far as to call a market top later that month!). Meisler made the excellent point that this time is different because of the sell-off in small-caps. In other words, the strong breadth this time around is not likely a blow-off of the last eager buyers; it is instead likely the eager rush of “bargain shoppers” stepping into the breach left by sellers.
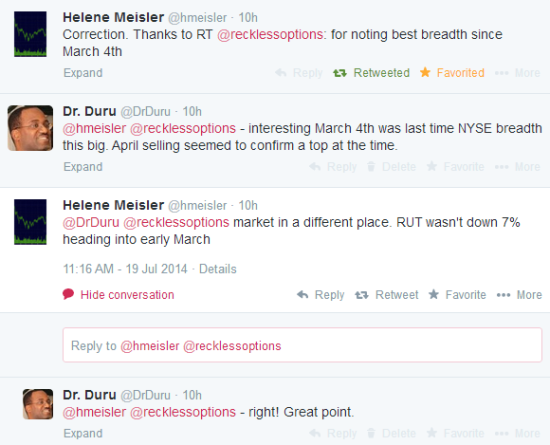
Source: Twitter
Contrast this observation to a bearish thesis grasping for a reason to stay bearish.
My guess is that expiration provided some "artificial" upside pressure. Lets see if strength can be maintained. Net short now.
— Douglas Kass (@DougKass) July 18, 2014
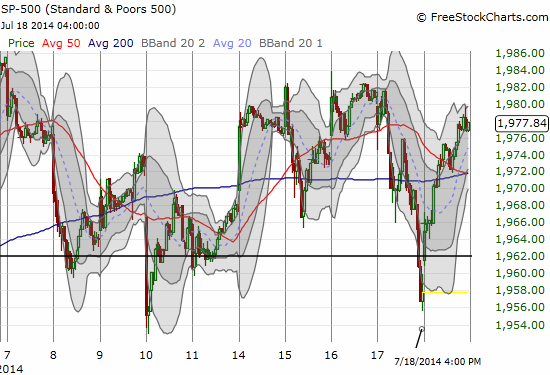
I will not go into the overall context since Kass churned rapidly in and out of his positioning through the rapid events. Just note that the switch back to net short happened within the first few minutes of the U.S. open, before it was clear that breadth was so strong. From my perspective, using the technicals I described for Thursday, the sudden gap up was an early warning/confirmation that the market was already prepared to leave Thursday’s pessimism behind. My advice to aggressive (bearish) traders in the last T2108 Update was to go short preferably on a fade. The gap above the old bear/bull line of 1962 on the S&P 500 hopefully told you folks to be cautious and stay patient. I definitely understand if you chose to fade near the close – just stay on your toes and continue to consider all such trades to be very short-term for now. The only thing in your favor right now is that the S&P 500 did not manage to recover ALL its losses from Thursday.
Kass’s idea to take into consideration the impact of options expiration is a good one. However, to interpret it better, I would like to know whether traders were positioned very bullishly or bearishly going into Friday. Absent that info, Monday becomes a critical test for follow-through. Stay tuned…!
Daily T2108 vs the S&P 500
")
Black line: T2108 (measured on the right); Green line: S&P 500 (for comparative purposes)
Red line: T2108 Overbought (70%); Blue line: T2108 Oversold (20%)
Weekly T2108

*All charts created using freestockcharts.com unless otherwise stated
Related links:
The T2108 Resource Page
Expanded daily chart of T2108 versus the S&P 500
Expanded weekly chart of T2108
Be careful out there!
Full disclosure: long UVXY puts
Hi Dr. Dru, thanks for writing this column I read it every week.
There’s a few things I don’t fully understand this week and that is the significance of the RUT move and also the significance of ‘breadth’. In fact I’m not even sure what you mean by breadth, let alone it’s actual significance here.
Thanks!!
Simon
Hi Simon!
First of all, thanks for reading.
RUT is shorthand for the Russell 2000. You can see it in FreeStockCharts.com using the symbol RUT-X. IWM is the equivalent ETF. It is an index of the 2000 ‘representative’ small caps, I believe the largest of the small caps. “Breadth”, simply put, is a measure of the distribution of buying in the market. When breadth is large, it means buyers are supporting a large amount of stocks. In other words, they are not narrowly focused on just the best stocks. The implication is that buyers see a lot of value in the entire stock market. When it happens at the tail-end of a lot of selling, it means these buyers are readily stepping in where the sellers exited, perhaps signifying an end to the net selling and a bottom. I hope that helps. Feel free to ask any follow-ups.
Hi, thanks for the reply and sorry – I just realized I got your name wrong on the first email!
I get what you mean by breadth, but the reference to the RUT is still confusing me. It’s the tweet that mentions the RUT not being down 7%. “RUT wasn’t down 7% heading into March”
I guess I’m just not sure what the significance/ meaning is here.
Thanks again!!
Simon
Helene was referring to the relative position of the market. First of all, we start of assuming that the strong breadth Helene references applies also to the 2000 stocks in the RUT. The RUT is key to the interpretation because it is one of the few major indices that is well off its highs. Getting a strong buying signal there tells us that the selling is likely over and the RUT is going to head higher. It is hard to imagine an imminent correction with RUT rallying back toward its highs. Back in March, all the major indices, including RUT were at highs. In THAT case, we can’t make the assessment that strong buying represents buyers taking over from the weaker hands of sellers. Instead, we have to wonder whether it is a buying blow-off. What sometimes happens at tops is that the last skeptics finally rush in to buy, snapping up everything, afraid they might miss the train if they don’t finally give in. Unfortunately for them, they tend to be the last buyers in a market.
Fortunately for the indices, once the correction came in April, selling was quickly exhausted and we headed higher. So, as I implied, making the call of a top was a good in March, it just didn’t last long. Other factors came into play after that April correction….
No worries on the name.
Hi Dr. Duru, thanks very much for the lengthy reply! I get the rationale now.
I just discovered the T2101 Breadth Index a few days ago and wasn’t totally sure of it’s meaning. At least now I can keep track of it and understand what’s going on.
Cheers
Simon
No problem. You’re welcome. Looks like T2101 is absolute breadth and not showing what Helene was talking about. I think we have to look for another breadth indicator. (I know, confusing!)