
(T2108 measures the percentage of stocks trading above their respective 40-day moving averages [DMAs]. It helps to identify extremes in market sentiment that are likely to reverse. To learn more about it, see my T2108 Resource Page. You can follow real-time T2108 commentary on twitter using the #T2108 hashtag. T2108-related trades and other trades are posted on twitter using the #120trade hashtag)
T2108 Status: 70.2% (fourth overbought day)
VIX Status: 11.0
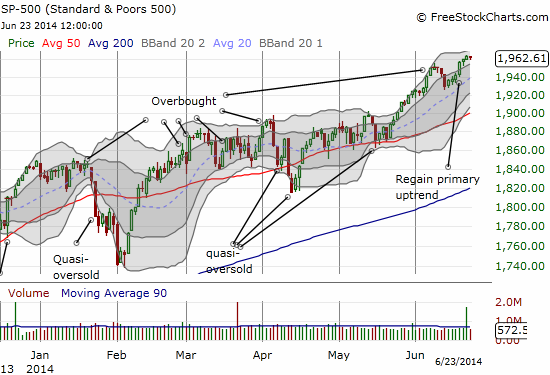
General (Short-term) Trading Call: Aggressive traders go or stay long. Stop below 1940 on the S&P 500
Active T2108 periods: Day #242 over 20%, Day #94 over 40%, Day #21 over 60%, Day #4 over 70% (overperiod)
Reference Charts (click for view of last 6 months from Stockcharts.com):
S&P 500 or SPY
SDS (ProShares UltraShort S&P500)
U.S. Dollar Index (volatility index)
EEM (iShares MSCI Emerging Markets)
VIX (volatility index)
VXX (iPath S&P 500 VIX Short-Term Futures ETN)
EWG (iShares MSCI Germany Index Fund)
CAT (Caterpillar).
Commentary
So much for bursting upward into the current overbought period.
Last week I thought T2108 showed every sign of leading the market into an extended overbought rally. Instead, it has spent a third day since then barely resting on the edge of overbought territory (70% or higher). It has teetered while the S&P 500 has ever so tentatively nudged higher by inches.
The only thing to do right now is continue waiting for confirmation. I have yet to make a bullish move on the S&P 500 (SPY), but I have continued to make more and more aggressive bullish plays on stocks with good technical setups. For some more perspective on why I think the market is more likely to burst to the upside than not, here is a weekly chart for T2108 showing a strong push upward since the lows in June, 2013. Notice how each pullback has met higher lows. The wedge-like formation demonstrates how more and more stocks have been climbing uptrends and staying there…even THROUGH this year’s sell-off in high-multiple and momentum stocks.
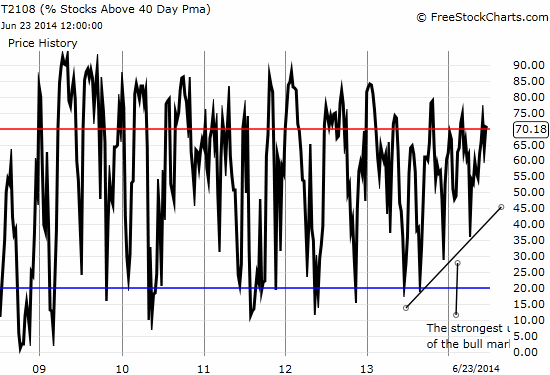
If a trader wants to get super-technical about this chart, one could argue there is a very slight downtrend on the high side of the wedge (lower highs). However, I think it is a close call. Even if it is there, then T2108 should at least get to 75% or so before ending the current run.
I have four stocks of particular interest today: Rocket Fuel (FUEL), Twitter (TWTR), Google (GOOG), and Apple (AAPL) (note that three of the four are internet plays – probably not an accident?).
FUEL gets special recognition as the stock has finally broken out from under its 50DMA downward trend. Regular readers will recall that it was the heavy volume selling in FUEL that alerted me to the possibility that a “cessation in hostilities” could be on the horizon for momentum stocks. At the time, I could not have and did not guess that the run would last THIS long and unfold so steadily persistent. Such bullishness would have paid off handsomely! FUEL has put on a clinic for washing out sellers: high volume trading transferred stock from capitulators to speculators. The over-extension below the lower-Bollinger Band (BB) was the clincher. I am still long FUEL. Seeing the stock close the post-earnings gap down and continue higher makes me even more bullish – the move effectively invalidates whatever FUEL said in the last earnings call that caused so much angst.

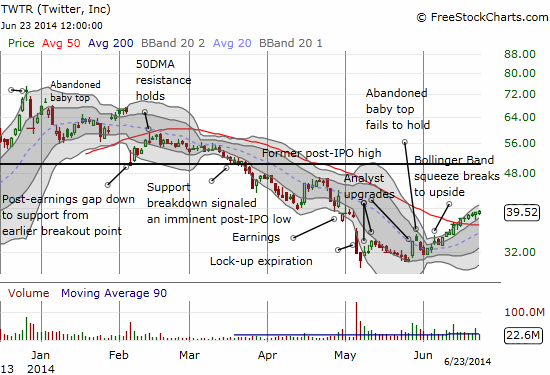
TWTR has also had a nice bounce after high-volume selling washed out the most ardent sellers from the system. I persisted in making the bullish case for TWTR in several posts as a good play off the bottom as analysts started showing up with upgrades from bearishness to bullishness on the stock. TWTR was a great example of how a change in analyst sentiment CAN help traders. I closed out the last of these trades last week. I think I still want to buy TWTR on dips. It is simply too “expensive” for me to hold much longer at this point and these levels.
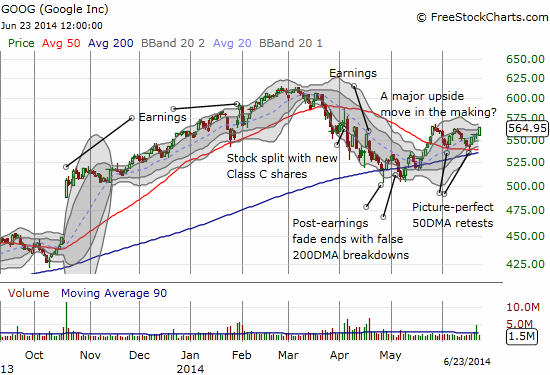
I feel like I have pounded the table for GOOG too much, but I cannot help it. It is rare to see such a bullish setup develop in such slow motion. GOOG has even put on a clinic with two picture-perfect retests of 50DMA support. I think GOOG will be off to the races if it closes above the May high soon (around $566 on May 27th). While waiting for the breakout, I have tried playing short-term moves with options and some stock. Today’s 1.5% display of relative strength was the best move of the bunch. I locked in the profits (a smidgen early as I watched resistance a little too warily). I plan to be even more aggressive on a breakout and likely even bet bullishly on earnings if this display of technical beauty persists that long.
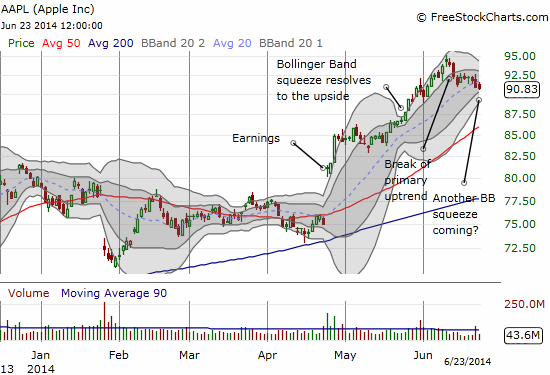
I end with AAPL. This SHOULD be the crowning moment of bullishness for a bullish overbought period. Alas, AAPL has sagged its way into relative weakness the past two weeks. The palpable explanation is a mild sell-the-news reaction to the 7:1 stock split. The Apple Trading Model fared very well in the first post-split week. It generated only two trades the following week which both failed as the stock essentially floated aimlessly until Friday’s drop. Monday also failed to produce. So, I have to put the ATM back on “watch” as I wonder again whether it can remain valid in this post-split world. As a reminder, it is very possible I will have to put the model on the shelf until I collect at least several more months of data to compare post and pre-split trading behavior.
Now, AAPL seems to be stumbling into another Bollinger Band (BB) squeeze. I think an incredible opportunity is unfolding. A retest of the 50DMA would be an absolute gift in preparation for a likely bull run into October earnings and new product announcements. However, given the strong bullish sentiment in AAPL, I do not think buyers will let AAPL fall that far…and thus a fresh BB squeeze SHOULD resolve to the upside. Stay tuned!
Daily T2108 vs the S&P 500
")
Black line: T2108 (measured on the right); Green line: S&P 500 (for comparative purposes)
Red line: T2108 Overbought (70%); Blue line: T2108 Oversold (20%)
Weekly T2108

*All charts created using freestockcharts.com unless otherwise stated
Related links:
The T2108 Resource Page
Expanded daily chart of T2108 versus the S&P 500
Expanded weekly chart of T2108
Be careful out there!
Full disclosure: long AAPL calls, long FUEL