
(T2108 measures the percentage of stocks trading above their respective 40-day moving averages [DMAs]. It helps to identify extremes in market sentiment that are likely to reverse. To learn more about it, see my T2108 Resource Page. You can follow real-time T2108 commentary on twitter using the #T2108 hashtag. T2108-related trades and other trades are posted on twitter using the #120trade hashtag)
T2108 Status: 70.3% (first overbought day)
VIX Status: 10.6 (dropped 12%)
General (Short-term) Trading Call: Aggressive traders go or stay long. Stop below today’s low (1940 on the S&P 500)
Active T2108 periods: Day #239 over 20%, Day #91 over 40%, Day #18 over 60%, Day #1 under 70% (overperiod)
Reference Charts (click for view of last 6 months from Stockcharts.com):
S&P 500 or SPY
SDS (ProShares UltraShort S&P500)
U.S. Dollar Index (volatility index)
EEM (iShares MSCI Emerging Markets)
VIX (volatility index)
VXX (iPath S&P 500 VIX Short-Term Futures ETN)
EWG (iShares MSCI Germany Index Fund)
CAT (Caterpillar).
Commentary
The market’s seams are erupting to the upside.
Today’s post-Fed reaction featured a delicious irony. Central banks have been complaining and complaining about low implied volatility in global financial markets, under-pricing of risk, and low yields on risky bonds. Today’s trading took the alleged “implied complacency” to a deeper level as the Federal Reserve’s latest statement on monetary policy helped deliver a surge in the S&P 500 (SPY) to a fresh (marginal) all-time high along with a fresh plunge in volatility to 7-year lows.
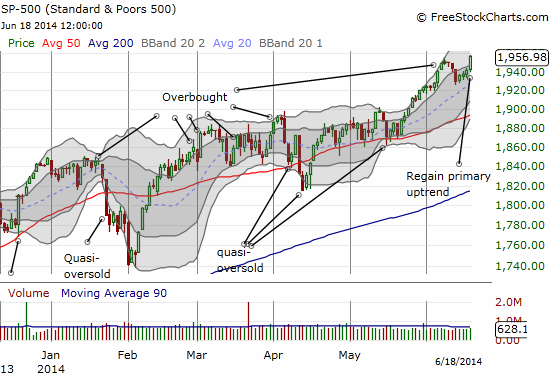
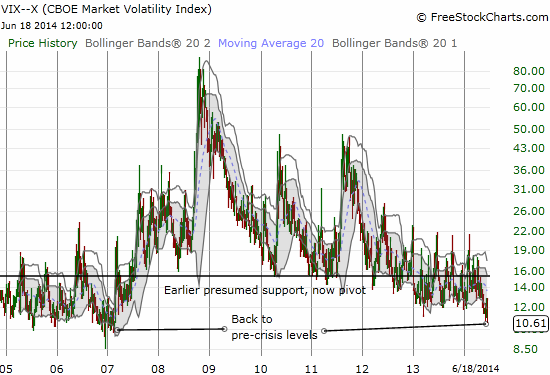
I think the two charts (along with Fed Chair Janet Yellen) are the pictures that say it all. Overbought conditions have started with a bang, and this is all the kindling needed for a summertime rally.
For traders, this is a time to ride the upward trend: get back on or stay on. As a reminder, SwingTradeBot.com can provide a lot of trading ideas depending on various chart technicals. Currently, Bollinger Band (BB) squeezes are erupting everywhere.
My revamp of T2108 observations during overbought conditions has made me much more disciplined and removed most of the desire to fight against the wind here. This patience is reinforced by the fleeting bearish signal delivered by the last breakdown from overbought conditions. Recall that after about 20 trading days, the overbought period gets MORE bullish in terms of its overall potential duration and price performance when it ends.
The next opportunities to return to the land of the bears are 1) a breakdown from overbought conditions along with a close below today’s low and selling follow-through and/or 2) some kind of climactic top (that read will depend on chart technicals). Without one of these, let the market run if that is what it wants to do…!
Daily T2108 vs the S&P 500
")
Black line: T2108 (measured on the right); Green line: S&P 500 (for comparative purposes)
Red line: T2108 Overbought (70%); Blue line: T2108 Oversold (20%)
Weekly T2108

*All charts created using freestockcharts.com unless otherwise stated
Related links:
The T2108 Resource Page
Expanded daily chart of T2108 versus the S&P 500
Expanded weekly chart of T2108
Be careful out there!
Full disclosure: no positions
Which SSO puts are you in?
Those expired last Friday worthless. I am holding off on buying a fresh batch until one of the rules trigger. I will correct my disclosure as I shouldn’t list worthless positions.