
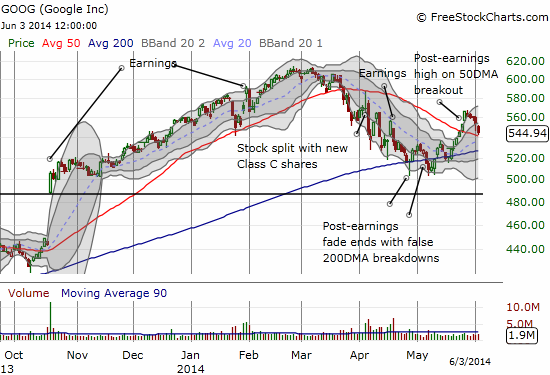
I thought Google (GOOG) was “finished” when it broke through 200-day moving average (DMA) support. I next noticed the importance of a bounce from 200DMA resistance turned support but failed to make the trade. The stock barely paused at 50DMA resistance and formed an impressive breakout that ended with a new post-earnings high. However, as with so many strong runs that generate an extension well beyond the Bollinger Bands (BBs), the move came to a quick and sudden end. Now, GOOG has traded down five straight days and hovers directly over its 50DMA.
Source: FreeStockCharts.com
GOOG’s chart continues to attract my interest given the bounce from the still upward trending 200DMA remains intact. The recent rally put a sharp bend in the 20DMA that changed a downtrend to a budding uptrend. So, if the 50DMA holds as support, GOOG could be off to the races. And even if it fails, the 20 and 200DMAs will still provide additional points of potential support.
My bullish read is quite different from the bearish one I found in “Google chart has some worried.” In this CNBC piece, technician Richard Ross made his main feature a head and shoulders pattern delivering resistance to the recent rally.

“‘Google is a company that I really like,’ said Ross, a ‘Talking Numbers’ contributor. ‘But, it’s not a stock that I like here, and I would be a seller of Google.’
Google’s Class C shares made a head-and-shoulder formation in the beginning of the year. During the NASDAQ Composite’s 10 percent pullback from early March to mid-April, Google had a pullback of roughly 16 percent. At one point, Google even broke below its technically significant 200-day moving average. ‘We close below it but only for one day,’ Ross said in what he describes as a ‘false breakdown.’
Google shares subsequently rebounded from its May lows but will face resistance around $580 per share, according to Ross’ charts. That’s the level of where the pattern’s shoulders.
‘Absent of a break back above that key resistance, I would be seller of Google here,’ Ross said. ‘I think we revisit that 200-day moving average [currently at $527.80], we break below it, and go even lower still.'”
While I give little credence to head and shoulders patterns because they seem to mainly work only in retrospect, I DO appreciate the focus on what HAS happened. That is, what just occurred was a pullback from a definitive resistance line. Of course, without using the H&S pattern, I called the pullback a natural reaction to a Bollinger Band over-extension. I am now more focused on what COULD happen with a bounce from support. If you are bearish GOOG, the time to short was when GOOG first sold off from the rally. That signal provided likely confirmation of a looming pullback. Now, the better risk/reward is to wait for a breakdown of the 200DMA.
Similarly, if you are bullish, this is a great spot to test your thesis. A more conservative approach would be to wait for the stock to show buying interest off the 50DMA.
I am surprised Ross is not more impressed with the successful retest of 200DMA support. He seems to recognize it as a key battleground. My analysis tells me then to give GOOG the bullish benefit of the doubt UNTIL that line gets broken.
Anyway, bearish caution is indeed warranted given the increasingly high levels of complacency in the market. However, I am always on the lookout for decent setups that give me an opportunity to hedge my other bearish bets. GOOG looks like just such a candidate chart.
Be careful out there!
Full disclosure: long GOOG call options
You cannot publish the same article on-line while you’re with those some online firms talked about above.
Please clarify. I am not clear what you are referring to.