
(T2108 measures the percentage of stocks trading above their respective 40-day moving averages [DMAs]. It helps to identify extremes in market sentiment that are likely to reverse. To learn more about it, see my T2108 Resource Page. You can follow real-time T2108 commentary on twitter using the #T2108 hashtag. T2108-related trades and other trades are posted on twitter using the #120trade hashtag)
T2108 Status: 66.6% (end a 4-day overbought period)
VIX Status: 12.1
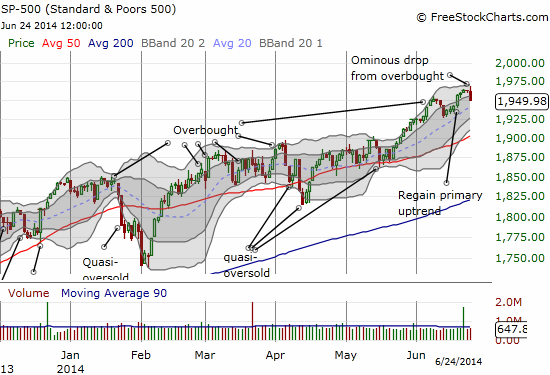
General (Short-term) Trading Call: Even aggressive traders hold. Longs still stop below 1940 on the S&P 500
Active T2108 periods: Day #243 over 20%, Day #95 over 40%, Day #22 over 60% (overperiod), Day #1 under 70% (underperiod)
Reference Charts (click for view of last 6 months from Stockcharts.com):
S&P 500 or SPY
SDS (ProShares UltraShort S&P500)
U.S. Dollar Index (volatility index)
EEM (iShares MSCI Emerging Markets)
VIX (volatility index)
VXX (iPath S&P 500 VIX Short-Term Futures ETN)
EWG (iShares MSCI Germany Index Fund)
CAT (Caterpillar).
Commentary
T2108 ended a very lacluster 4-day overbought period with a close at 66.6%. The extended overbought rally that I expected never even opened its eyes. Looking back, I feel very fortunate I made some good trades in individual stocks during the overbought period.
The dip in the S&P 500 (SPY) has a very classic bearish pattern: three days of indecisive trading followed by a pullback that easily wipes away the paltry gains of all three days. However, I am sticking with the original bearish trigger of a close below 1940 on the S&P 500. The market is moving in such slow motion that I think patience is warranted. The potential for getting trades chopped up in market churn remains high until the market somehow delivers a more clear directional signal. Moreover, the higher lows on T2108 suggest that the next pullback will be quite shallow.
The volatility index, the VIX, DID open its eyes, apparently waking from a deep slumber. It rose a healthy 10.4% in a move that should perk up the bears.
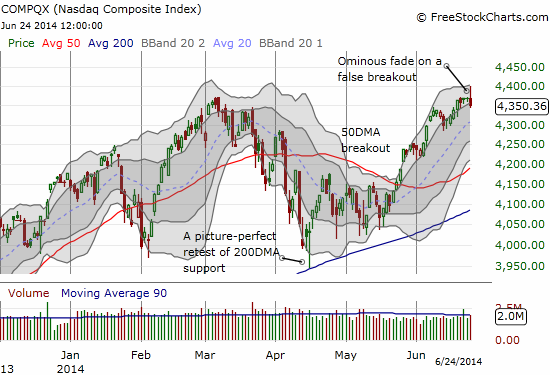
Under “normal” conditions, I would rush to buy puts on ProShares Ultra S&P500 (SSO) and/or PowerShares QQQ (QQQ) with this combination of signals. Again, I do not see a need to rush. If I find an individual stock with a good technical setup below resistance, I might try to short it for a quick trade. But that is as far as I will go on new trades. Note I DO think the bullish setups I noted in the last T2108 Update are already on probation given the way the NASDAQ (QQQ) faded from fresh multi-year highs. This kind of false breakout is typically a very bearish sign. I prefer to have the wind behind my back, especially when dealing with high-multiple and/or (former) momentum stocks.
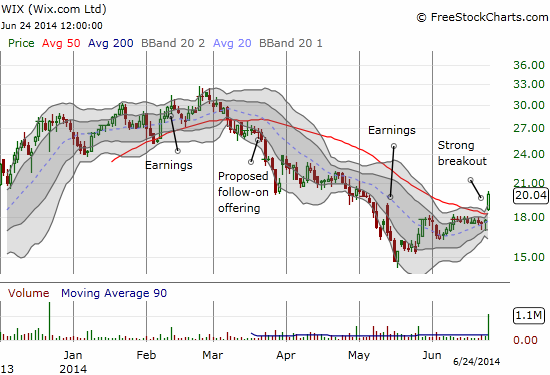
Finally, here is an interesting contrast to the gathering bearish clouds. Wix.com (WIX) cleanly broke out above its 50DMA with high buying volume. This is one stock I am going to try to hold. It is even a fresh buy here with a stop below the 50DMA.
Daily T2108 vs the S&P 500
")
Black line: T2108 (measured on the right); Green line: S&P 500 (for comparative purposes)
Red line: T2108 Overbought (70%); Blue line: T2108 Oversold (20%)
Weekly T2108

*All charts created using freestockcharts.com unless otherwise stated
Related links:
The T2108 Resource Page
Expanded daily chart of T2108 versus the S&P 500
Expanded weekly chart of T2108
Be careful out there!
Full disclosure: long WIX