
(T2108 measures the percentage of stocks trading above their respective 40-day moving averages [DMAs]. It helps to identify extremes in market sentiment that are likely to reverse. To learn more about it, see my T2108 Resource Page. You can follow real-time T2108 commentary on twitter using the #T2108 hashtag. T2108-related trades and other trades are posted on twitter using the #120trade hashtag)
T2108 Status: 51.5%
VIX Status: 13.2
General (Short-term) Trading Call: Short (fade rallies, especially in tech).
Active T2108 periods: Day #216 over 20%, Day #68 over 40%, Day #21 over 50% (over-period), Day #1 under 60% (under-period), Day #28 under 70%
Reference Charts (click for view of last 6 months from Stockcharts.com):
S&P 500 or SPY
SDS (ProShares UltraShort S&P500)
U.S. Dollar Index (volatility index)
EEM (iShares MSCI Emerging Markets)
VIX (volatility index)
VXX (iPath S&P 500 VIX Short-Term Futures ETN)
EWG (iShares MSCI Germany Index Fund)
CAT (Caterpillar).
Commentary
I chose the title as a tongue-in-cheek echo of the typical attempts by the media to explain the gyrations in the stock market…if the market grabs a gain, look for positive catalysts; if the market drops, look for negative catalysts. Listening to the radio on the way back home, I heard a litany of excuses to explain the losses, and volatility was not on the list. Now, I have fixed that problem.
I pointed out in the last T2108 Update, called “Volatility Watch,” that volatility had dropped toward the bottom of an extended trading range. Over this range, volatility has spent little time at these lows – in fact, often bouncing right away. This time around, it took three more days for the bounce to finally arrive.
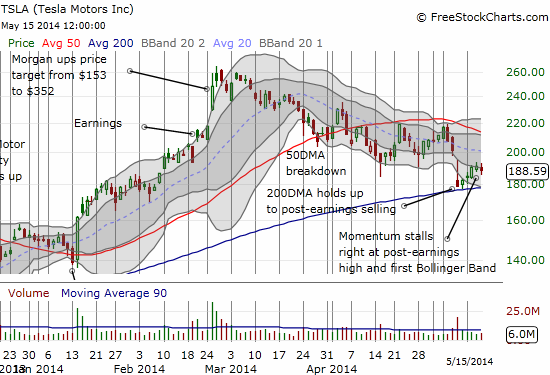
The low volatility made me hesitate about my earlier thesis that the selling in momentum/expensive/high-flying stocks had finally abated (I called it a “looming cessation in hostilities“). Throw in T2108 closing in on overbought levels, and I specifically decided to pull back on my most aggressive and risky longs to play bounces off support. My prime target was to close out a short put on Tesla (TSLA). Amazingly, TSLA continued to chug along and managed to “only” lose 1.1% on a day its cousins in the valuation stratosphere easily lost 2 to 4% or so at various points in the day. However, the chart below shows that the bounce for TSLA may already have come to an end. Declining 20 and 50DMAs loom overhead if TSLA manages to break through current resistance.
Other important trades since the last T2108 Update: sold calls on iShares MSCI Emerging Markets (EEM) (but neglected to turn around and buy puts), made successful options trades (2 of 2!) using the Apple Trading Model (ATM), and closed out my short on Workday (WDAY) (the puts are likely to expire worthless tomorrow though). I am still holding the call options on ProShares UltraShort QQQ (QID) and put options on ProShares Ultra S&P 500 (SSO). Note that I have also developed a TSLA trading model that is currently in test mode. If it performs well with low classification errors, look for a roll-out in a few weeks. So far, TSLA has behaved as consistently as AAPL.
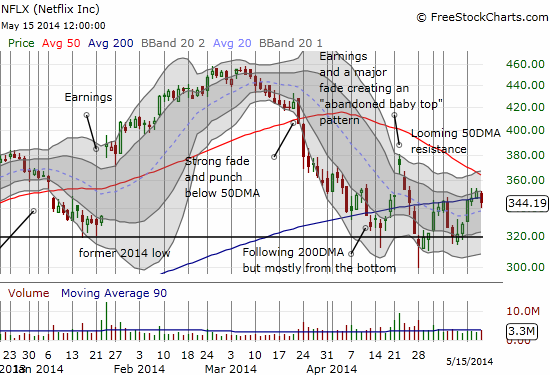
Two new trades of note. I roundtripped a short on Netflix (NFLX). I noticed the stock had cracked its 200DMA, and the market gave me one more chance to fade off 200DMA as resistance. I closed out the position after NFLX’s loss reached 3% or so on the day. I did not want to press my luck. The chart below shows a big technical “moment of truth” looming for NFLX with a rapidly declining 50DMA crashing down on a rising 200DMA. Whatever happens, I strongly suspect NFLX’s post-earnings high will hold as a top/resistance for quite some time to come. In other words, I am no longer bullish on the stock.
Finally, for a flyer, I bought a single call option on Google (GOOG) which expires Friday as a play for a bounce from the 200DMA. For last Friday’s T2108 Update, I produced a cornucopia of charts with important technical levels and things have played out amazingly well. The GOOG trade is made in that spirit.
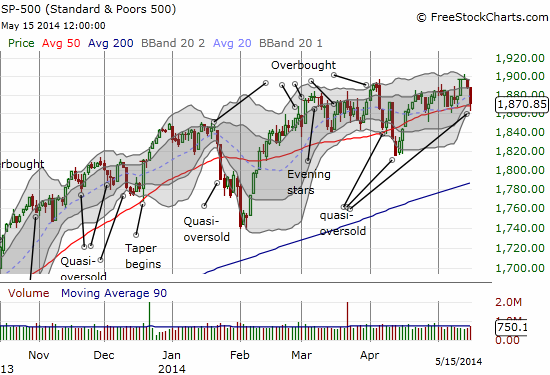
Speaking of technicals, the S&P 500’s 0.9% sell-off ended with a close just above the 50DMA (again, you just can’t make this stuff up!). The selling only feels bad because of the buying that started the week. Note in the chart below how the S&P 500 has simply churned over and over and over again for almost three months…all the while the 50DMA creeps steadily higher. My mid-March thesis for a top is still holding on, but barely.
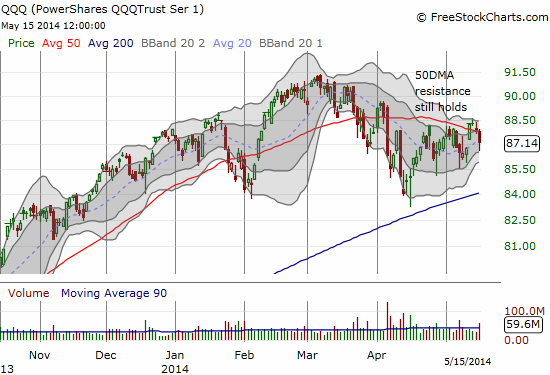
At the same time 50DMA support held for the S&P 500, the 50DMA produced resistance for the PowerShares QQQ (QQQ). The “doji” that forms the top of the week has the appearance of a false breakout above the 50DMA…thus, my desire to hold onto my QID calls, using the GOOG call as a partial hedge just for one day.
Finally, T2108 plunged 11% to close at 51.5%. The 2-day plunge of 17% qualified T2108 for quasi-oversold status. Unfortunately, The T2108 Trading Model (TTM) at these levels produced poor results with a 50% classification error! A literal flip of the coin as to whether Friday will generate a bounce or not. I already have my headline ready: if the S&P 500 bounces, then it is “Stocks Stage A Comeback On Quasi-Oversold Conditions”; if the S&P 500 drops, then it is “Stocks Hit Again By Low Volatility.” Stay tuned!
Daily T2108 vs the S&P 500
")
Black line: T2108 (measured on the right); Green line: S&P 500 (for comparative purposes)
Red line: T2108 Overbought (70%); Blue line: T2108 Oversold (20%)
Weekly T2108

*All charts created using freestockcharts.com unless otherwise stated
Related links:
The T2108 Resource Page
Expanded daily chart of T2108 versus the S&P 500
Expanded weekly chart of T2108
Be careful out there!
Full disclosure: long SSO puts, long QID calls, long AAPL shares, long GOOG call