
(T2108 measures the percentage of stocks trading above their respective 40-day moving averages [DMAs]. It helps to identify extremes in market sentiment that are likely to reverse. To learn more about it, see my T2108 Resource Page. You can follow real-time T2108 commentary on twitter using the #T2108 hashtag. T2108-related trades and other trades are posted on twitter using the #120trade hashtag)
T2108 Status: 61.8%
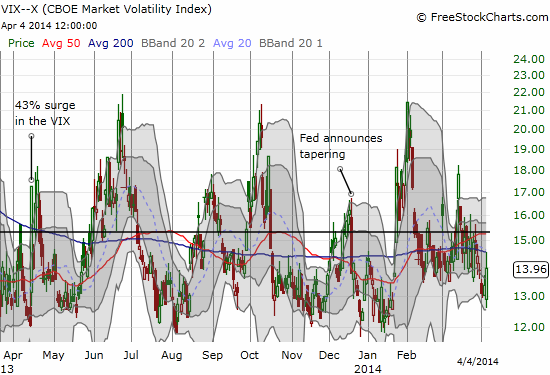
VIX Status: 14.1
General (Short-term) Trading Call: Short (fade rallies)
Active T2108 periods: Day #189 over 20%, Day #38 over 50%, Day #6 over 60%, Day #2 under 70% (underperiod)
Reference Charts (click for view of last 6 months from Stockcharts.com):
S&P 500 or SPY
SDS (ProShares UltraShort S&P500)
U.S. Dollar Index (volatility index)
EEM (iShares MSCI Emerging Markets)
VIX (volatility index)
VXX (iPath S&P 500 VIX Short-Term Futures ETN)
EWG (iShares MSCI Germany Index Fund)
CAT (Caterpillar).
Commentary
From the headlines and tweets I am seeing, the market narrative has fully accepted that momentum stocks have died (or are dying, depending on your perspective). Friday, April 4, 2014 was a replay of the carnage seen when 50DMAs were getting sliced like so much butter. Now 200DMAs are getting violated on many momentum stocks. 200DMA breakdowns signal the potential end of uptrends, not just short-term pullbacks.
It is interesting to see how the narrative shifts to fit the market mood. When momentum names were unstoppable, the narrative molded to the action and rationalized that investors are paying up for strong growth. Since nothing fundamental has changed to explain the sudden plunges, the narrative remolds to fit what is happening: suddenly, investors and traders no longer want to pay up. A Reuters article titled “Momentum names may see more pain” is a classic example of this process of molding narratives to follow the market action (what I also charitably call technical analysis disguised as fundamental analysis!).
The first paragraph plunges right into the supposed explanation:
“After their worst week in several years, high-flying stocks that defied gravity throughout 2013 look like they’re in for more punishment. The reason: Despite the plunge, they still look overvalued.”
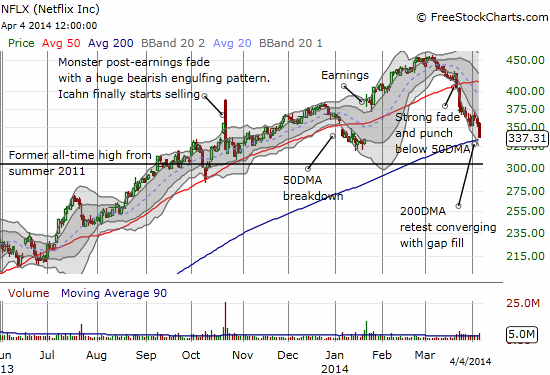
In a later section called “Oversupply,” we are told: “Since stocks like Netflix carry valuations far above most of the market, some investors are reluctant to buy them now.”
These claims of course beg the question: if these stocks are still overvalued after this sell-off, and given the stock prices are lower than when investors were eagerly buying, why were investors buying them in the first place? The article gives no direct answer, but the implicit explanation comes from the quotes of several analysts. Basically, these stocks are falling out of favor because, well, because they are falling.
From Mike O’Rourke, chief market strategist at JonesTrading: “There’s value somewhere, but since these things aren’t being traded off typical valuations, you can’t go by those metrics, and it’s more about when do you find that stability.”
From Kim Forrest, senior equity research analyst at Fort Pitt Capital Group: “For momentum stocks to work, you need people to believe they can go higher.”
The ultimate irony is that Friday’s big sell-off came on a day when the U.S. government released jobs numbers that were just as good (or bad depending on your perspective) as so many others before it:
“The declines have come at a time when investors overall are seeing a general improvement in economic figures, including Friday’s nonfarm payrolls data, which showed strong job gains in March and more people moving into the labor force.”
Given this backdrop, paying attention to the technicals becomes more valuable than ever. From the time I started flagging the shift in behavior in mid-March, the technicals have told us everything we need to know about the market’s willingness to change the narrative.
The next irony will come as the market finally accepts/concludes that momentum stocks are dead. Next will come a realization that perhaps the market has topped. That moment should finally deliver an oversold period in the stock market that will create one of the better buying opportunities we have seen since the market was last oversold in June, 2013.
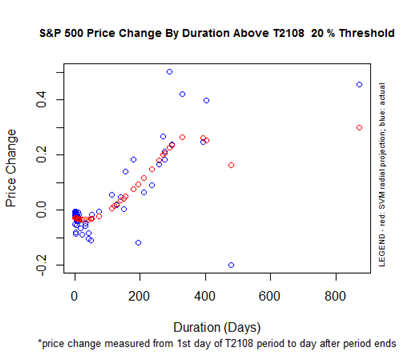
It has been 189 trading days since the the market was last oversold (T2108 below 20%). The projected performance for the S&P 500 (SPY) after the end of a 198-day 20% overperiod is 9-10%. To-date, the S&P 500 is up 18.6% for the current 20% overperiod. A 10% gain from the last oversold day on June 24, 2013 puts the S&P 500 at 1730.3. A drop from the current level of 1865 to that point would deliver a 7.2% correction, “close enough” to the long anticipated 10% correction. I have generated these numbers to provide rough parameters for a more extended sell-off. Note well that I will not be surprised if the market churns for months to come before this top gets an exclamation point.
While I suspect a more extended sell-off is finally on its way, the confirming signals that I have monitored have still not all converged to sing with one voice. Here is a quick review of the holdouts with charts following the list. Each one finally showed important signs of weakness on Friday.
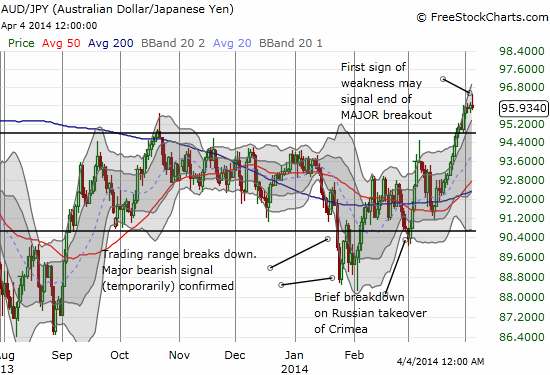
- The Australian dollar (FXA) remains strong. However, the commodity-driven currency faded hard against the Japanese yen (FXY) on Friday. Further selling will finally deliver a confirming signal.
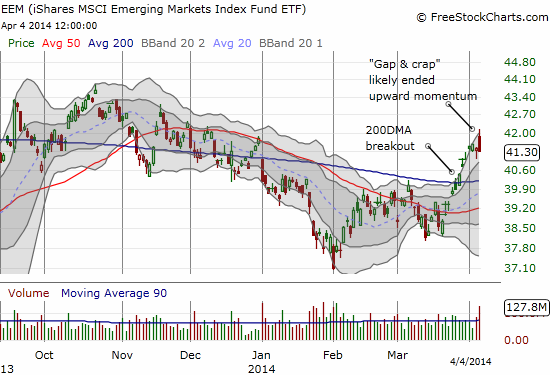
- Emerging markets as represent by iShares MSCI Emerging Markets (EEM) faded just like AUD/JPY. When it gapped up on Friday, I thought it was providing non-confirmation of Friday’s risk-based selling. Now, follow-through selling will finally deliver a confirming signal of bearishness. The strength in emerging markets has been one of the most bewildering non-confirmations. I like a trading strategy here that uses call and put options as EEM is likely to sprint far and fast in whatever direction it is heading under these increasingly volatile conditions. EEM is already up 7.1% in the current 2-week sprint.
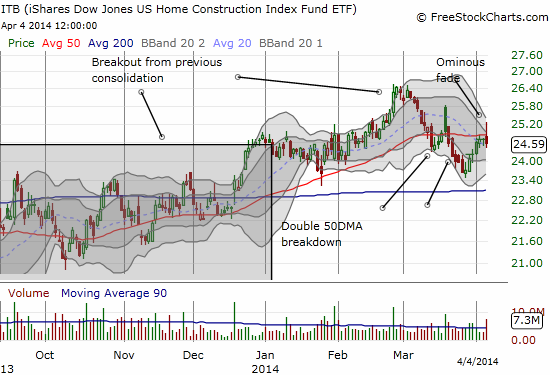
- Home builders as represented by iShares US Home Construction (ITB) were early in the current sell-off. I found it hard to be bearish on the market when home builders were trading strongly. When I finally conceded that their strength had ended, my mind was much freer to see the other bearish developments unfolding in the market. In the last week, home builders experienced a nice relief rally. They even rallied briefly on Friday only to reverse and close near flat on the day. Like AUD/JPY and EEM, further selling from here will provide a confirming signal for the bears.
One final holdout is the volatility index, the VIX. The VIX sprinted higher from multi-month lows on Friday, but it remains firmly encased within two months of churn. I do not get excited about the VIX until it closes above the 15.35 pivot. Note that recent history has demonstrated that such a move will be the beginning of the end of a VIX rally. Hopefully this time around, it will be part of a drive to oversold levels.
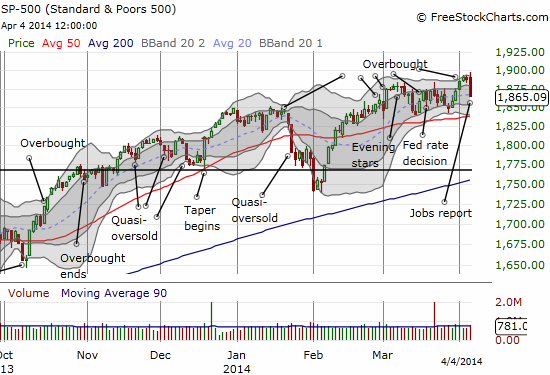
The S&P 500 (SPY) flipped the script on my mid-March call of a top for a few precious days. However, Friday’s new all-time high leading to a subsequent sell-off below that mid-March high all but confirms a top is in.
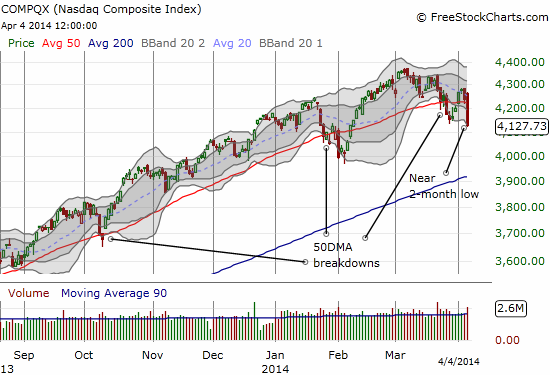
The even larger drop from the sky on the NASDAQ (QQQ) provides even more convincing evidence that upward momentum has come to an end.
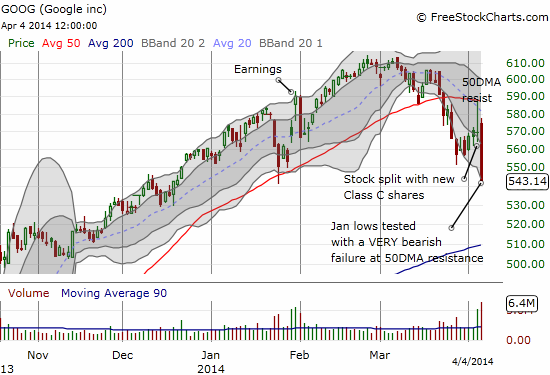
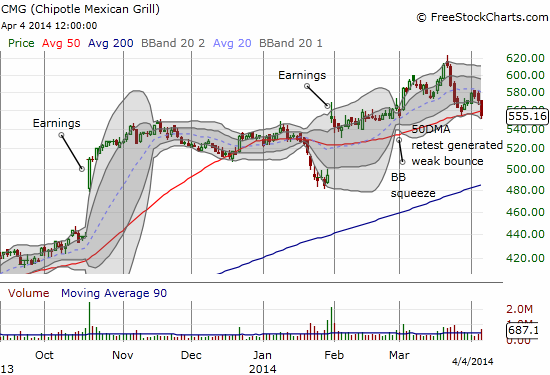
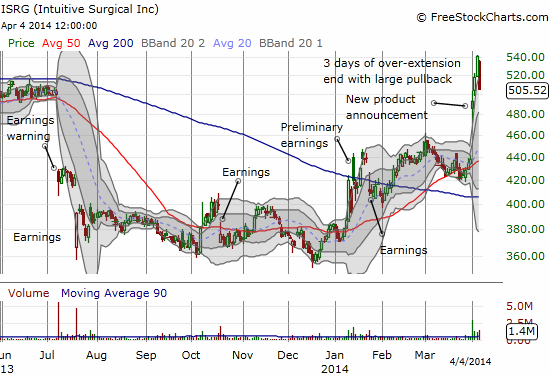
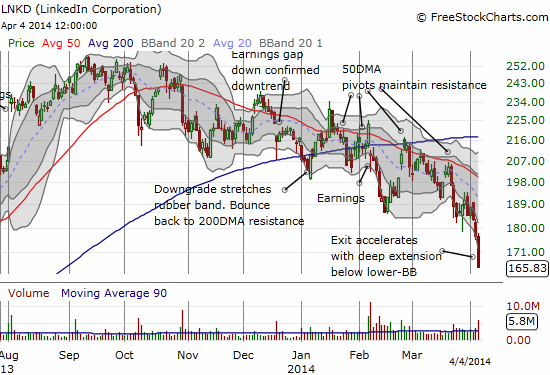
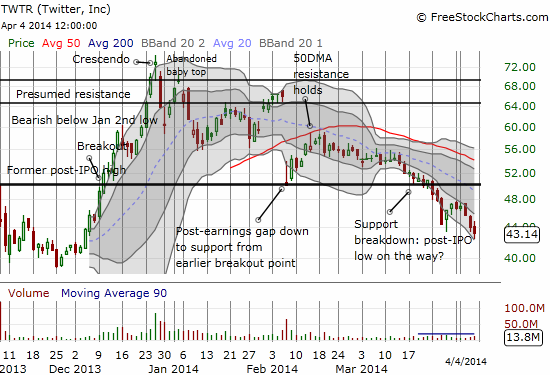
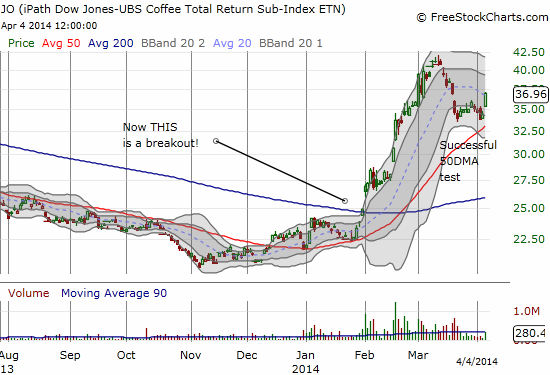
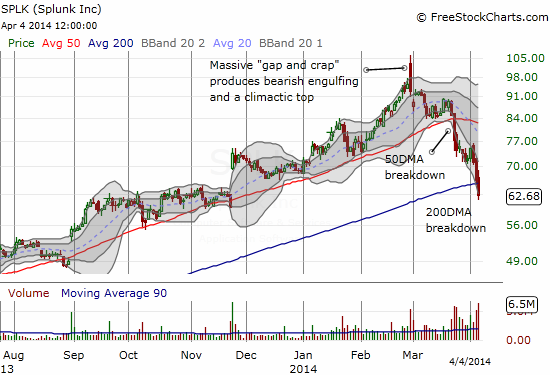
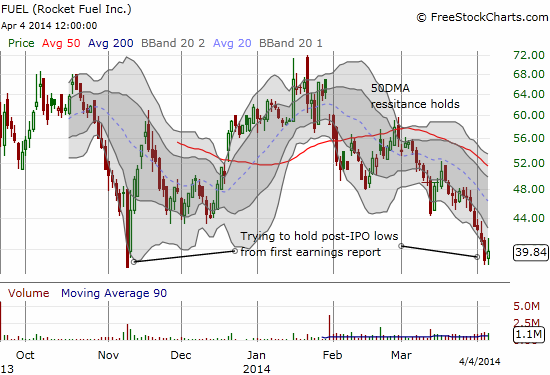
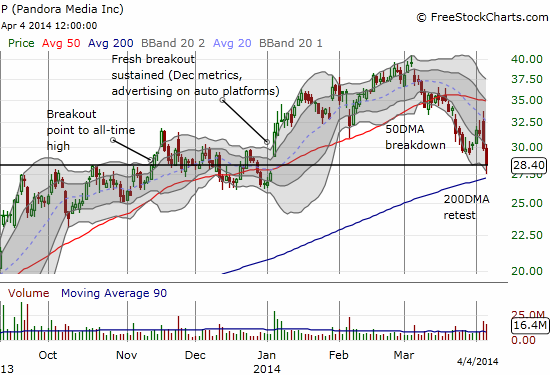
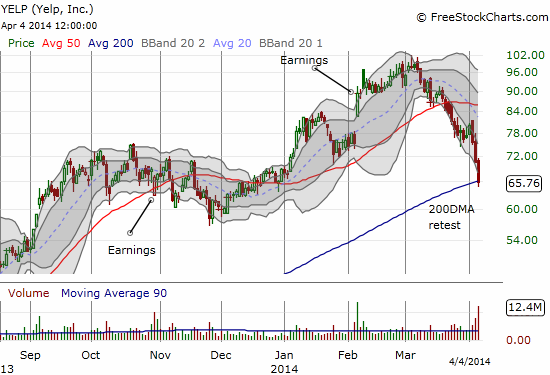
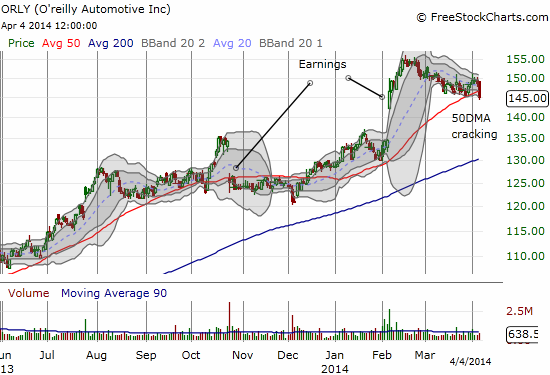
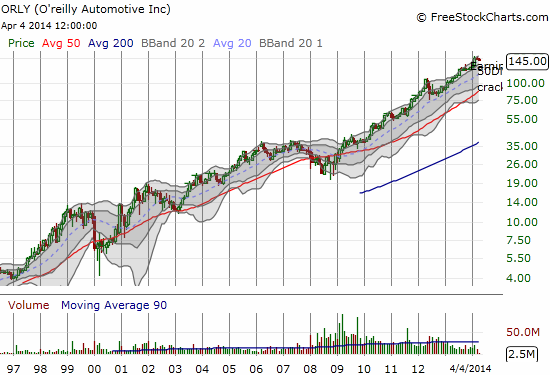
This sell-off continues to create some fascinating and very trade-able charts. I wish I could post every single one that has caught my attention. I will let the pictures speak for themselves in this small sample. Hopefully some of you have been able to catch some of the most spectacular of the trades I have followed in recent weeks.
When looking at any of these charts, pay careful attention to the following mileposts: behavior around the 50 and 200DMAs, position relative to the last earnings cycle (most momentum stocks have completely reversed those last set of monster gains), dominant trends, position relative to Bollinger Bands (BB) (trading well beyond them is unsustainable in the short-term but confirms the “ferocity” of an existing trend), and the filling of important gaps. In some cases, tests and retests are trade-able for a short-term bounce although waiting for confirmation is the more standard trade.
Daily T2108 vs the S&P 500
")
Black line: T2108 (measured on the right); Green line: S&P 500 (for comparative purposes)
Red line: T2108 Overbought (70%); Blue line: T2108 Oversold (20%)
Weekly T2108

*All charts created using freestockcharts.com unless otherwise stated
Related links:
The T2108 Resource Page
Expanded daily chart of T2108 versus the S&P 500
Expanded weekly chart of T2108
Be careful out there!
Full disclosure: long SSO puts, long LNKD shares and calls, long TWTR shares and calls, long FUEL, long YELP calls (Note well that these positions are left over after closing out almost all my bearish positions into Friday’s deep plunge. The trading call remains bearish but to fade rallies, NOT chase downward momentum).