
(T2108 measures the percentage of stocks trading above their respective 40-day moving averages [DMAs]. It helps to identify extremes in market sentiment that are likely to reverse. To learn more about it, see my T2108 Resource Page. You can follow real-time T2108 commentary on twitter using the #T2108 hashtag. T2108-related trades and other trades are posted on twitter using the #120trade hashtag)
T2108 Status: 52.1%
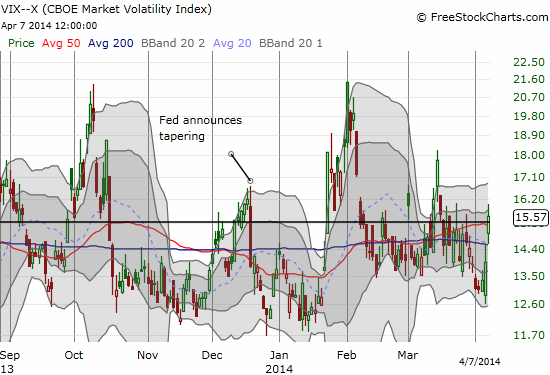
VIX Status: 15.6
General (Short-term) Trading Call: Short (fade rallies); there is an increased chance of a bounce for April 8th. See below…
Active T2108 periods: Day #190 over 20%, Day #39 over 50%, Day #1 under 60% (underperiod), Day #3 under 70% (underperiod)
Reference Charts (click for view of last 6 months from Stockcharts.com):
S&P 500 or SPY
SDS (ProShares UltraShort S&P500)
U.S. Dollar Index (volatility index)
EEM (iShares MSCI Emerging Markets)
VIX (volatility index)
VXX (iPath S&P 500 VIX Short-Term Futures ETN)
EWG (iShares MSCI Germany Index Fund)
CAT (Caterpillar).
Commentary
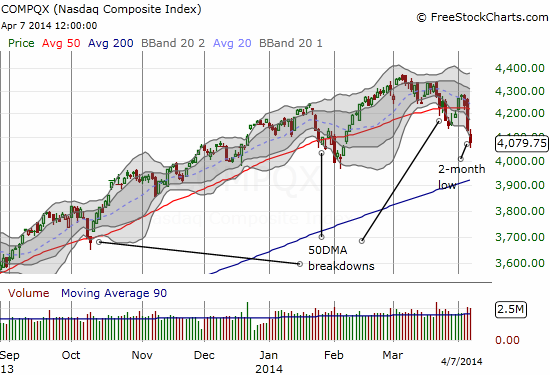
Now THIS is more like what I expect from a quick trip through overbought conditions. Since the last overbought period ended, the market has sold off for three straight days with the NASDAQ (QQQ) experiencing the brunt of the selling. The S&P 500 (SPY) is down 2.4% over this period but still remains above its 50-day moving average (DMA). The NASDAQ (QQQ), which has experienced a 2-week process of breaking through its 50DMA and turning it into resistance, is down 4.6% over the past three days. The NASDAQ is also down 6.4% from its recent highs set a month ago.
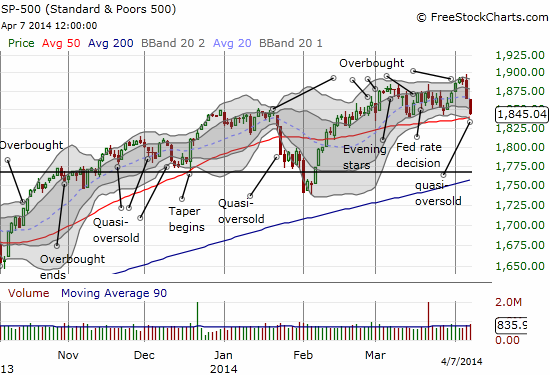
With T2108 plunging to 52.1%, the recent selling has produced quasi-oversold conditions. As a reminder, T2108, and the market, become quasi-oversold when T2108 drops “steeply” two days in a row. I have loosely defined steep on purpose, but I tend to prefer a 2-day drop of at least 15%. The current 2-day drop is a whopping 25%.
The T2108 Trading Model (TTM) is very dusty given the stubborn persistence of the market rising into overbought conditions this year, but it is still working. TTM produces 88% odds for a bounce on Tuesday, April 8th. HOWEVER, the classification error remains high on the model, now at 45%. Unfortunately, I have not yet had the opportunity to tinker with the model the last time I discovered the classification error had gotten so high (it was as lows as 25% when I first developed it a year ago). Until I get under the hood, I take these odds as guidance and a reminder not to chase stocks downward. The bearish trading bias to fade rallies remains firmly in effect.
The volatility index, the VIX, is providing a point for wariness. It managed to pop up above the 15.35 pivot. Such a move typically ushers in at least a few more days of high volatility (and selling). There have been occasions, like early December, whether the pivot provided resistance before a brief breakout.
Another reason for wariness about expecting an oversold bounce is the seeming recognition that the market is likely due for some kind of bounce. For example, CNBC’s cover story tonight is titled “Here’s why a momentum bounce could be looming.” The article did not provide any good rationales, but it is a catchy title that will certainly seep into the consciousness of anyone paying attention. Art Cashin also pointed out oversold conditions on CNBC in the middle of the trading session. Jim Cramer started the morning saying he would buy a few momentum names just to “try” for a bounce; he was very careful to say he is not calling a bottom here. (Yes, I know. I am starting to watch TOO much CNBC these days. More on that another day).
Cramer has always been a good story-teller. In today’s Mad Money show he weaved together a pretty good narrative for the current sell-off. Interestingly, he went as far to draw parallels to the action in 2000. Because the fundamentals of the economy are good, he is looking for buying opportunities once sellers exhaust themselves (oversold anyone?). His main point is that the sell-off is about the mechanics of the market…and this can of course help explain why the technicals are working so wonderfully right now. In particular, Cramer points out that the momentum managers that have driven stocks to crazy heights have cared much more about revenue growth than earnings growth. Once their buying power runs out, momentum names lose their support. Here is his summary explanation (ex-post of course):
- Too many IPOs chasing too few dollars.
- IPO insiders dumping more stock on the market.
- Novice investors descending into panic mode.
Cramer’s bottom line: until insiders stop selling and/or IPOs stop coming and/or more money comes into the market, every rally will get sold (very consistent with my trading bias for some time now).
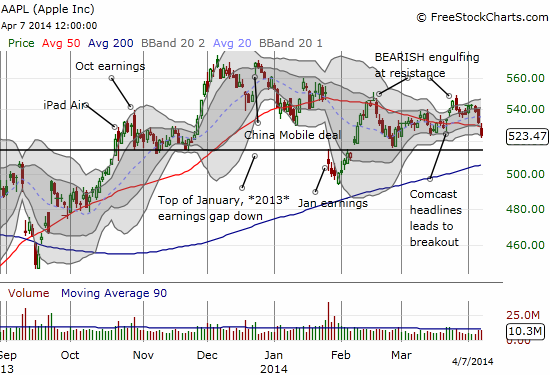
Finally, a look at Apple (AAPL).
AAPL has traded down two Monday’s in a row after never having a down Monday for all of 2014. I take this as a signal that “times are a-changing.” The Apple Trading Model (ATM) is not likely to work nearly as well as it has been. In fact, it is very possible that the stock will reverse its typical behaviors (up Mon to Wed, down Thu and Fri). I will be watching closely.
The ATM predicts a 100% chance of upside for Tuesday using data through 2013 and a 69% chance of upside using just 2014 data. The 2010 and 2011 reference points are also very bullish with 2012 on the edge. This is a situation where I would typically look to get extra bullish. Since I already have some call options in play, I will probably just try to ride those. Note in the chart below that AAPL has broken below a descending 50DMA. Even more important to notice is that AAPL is likely heading into an explosive earnings report on April 23rd as the wedge pattern from December, 2013 stretches toward 200DMA support. That support is now also converging with the important pivot from the top of the January, 2013 post-earnings gap down.
Daily T2108 vs the S&P 500
")
Black line: T2108 (measured on the right); Green line: S&P 500 (for comparative purposes)
Red line: T2108 Overbought (70%); Blue line: T2108 Oversold (20%)
Weekly T2108

*All charts created using freestockcharts.com unless otherwise stated
Related links:
The T2108 Resource Page
Expanded daily chart of T2108 versus the S&P 500
Expanded weekly chart of T2108
Be careful out there!
Full disclosure: long SSO puts, long AAPL shares and call options