
(T2108 measures the percentage of stocks trading above their respective 40-day moving averages [DMAs]. It helps to identify extremes in market sentiment that are likely to reverse. To learn more about it, see my T2108 Resource Page. You can follow real-time T2108 commentary on twitter using the #T2108 hashtag. T2108-related trades and other trades are posted on twitter using the #120trade hashtag)
T2108 Status: 63.8%
VIX Status: 15.1
General (Short-term) Trading Call: Short (fade rallies)
Active T2108 periods: Day #180 over 20%, Day #26 over 60% (overperiod), Day #4 under 70% (underperiod)
Reference Charts (click for view of last 6 months from Stockcharts.com):
S&P 500 or SPY
SDS (ProShares UltraShort S&P500)
U.S. Dollar Index (volatility index)
EEM (iShares MSCI Emerging Markets)
VIX (volatility index)
VXX (iPath S&P 500 VIX Short-Term Futures ETN)
EWG (iShares MSCI Germany Index Fund)
CAT (Caterpillar).
Commentary
T2108 closed down just two percentage points to 63.8%. The VIX, the volatility index, gained 0.6% but faded from a 7% gain at its highs for the day (continuing its tease around the 15.35 pivot). I could easily excuse you for thinking today was a relatively unexciting day. However, as the wide range in the VIX might suggest to those of us who follow it, a lot of fireworks did indeed happen today. In fact, it seemed like a day where momentum died. As confirmation to my last T2108 Update and subsequent “chart madness“, selling in momentum stocks followed through in spectacular fashion today. A quick compare and contrast between the S&P 500 (SPY) and the NASDAQ (QQQ) reveals where the sellers aimed their focus.
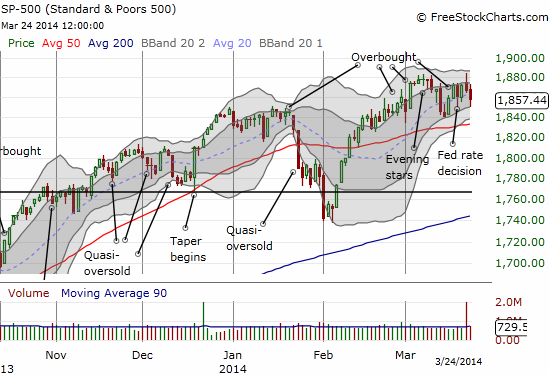
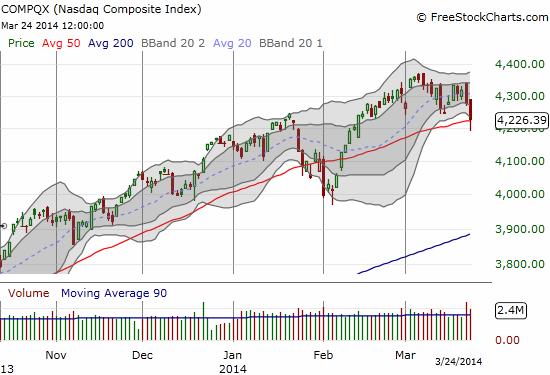
The S&P 500 closed down 0.49% while the NASDAQ closed down 1.18%. Even more significant was the NASDAQ’s breakdown below its 50DMA while the S&P 500 continues to churn. I strongly suspect technical traders recovered the NASDAQ from its plunge, but I think the damage is done and some kind of top all but confirmed. Momentum has been strong across a wide swath of tech stocks and most of the ones I highlighted in my last chart review were hit particularly hard. Instead of updating all these charts, I will just list their performance and any key technical events. You can click the ticker symbol to get a chart up to today’s date from StockCharts.com….
- Solar City (SCTY): Down 3.8% after trading as low as 9.7% below Friday’s close. Rally off the bottom did not quite return stock to its lower-Bollinger Band (BB)
- First Solar (FSLR): Essentially flat on the day. Sell-off? What sell-off? Keep sending that SCTY money on over…
- 3D Systems (DDD): Up 2.1%, a small recovery from Friday’s big breakdown.
- Workday (WDAY): 50DMA breakdown. Large bounce from lows which stretched beyond lower-Bollinger Band (BB).
- iShares US Home Construction (ITB): Continuation selling.
- Groupon.com (GRPN): Continuation selling to bottom of consolidation range.
- Gilead (GILD): Essentially retested 200DMA before a remarkable recovery to flatline. Was down as much as 4.2%.
- Netflix (NFLX): 50DMA breakdown confirmed with a 6.7% plunge. It was down as much 8.8%. My put spread was quite timely but of course I wish I just loaded up on straight puts.
- Amazon.com (AMZN): 50DMA breakdown confirmed with a 2.4% loss. I covered my short position.
- LinkedIn.com (LNKD): 200DMA resistance confirmed with a 4.4% plunge. The stock recovered a bit from over-extension below the lower-BB. I sold my puts too early and then switched to weekly calls too early. I just missed what would have been a very profitable double-down by a few cents.
- Tableau Software, Inc. (DATA): 200DMA breakdown confirmed with a 4.7% plunge. A small recovery from the lows of the day was not enough to end the over-extension below the lower-BB.
- Starbucks (SBUX): A relatively small drop of 1.2%, but the upward momentum from 50/200DMA support appears over.
- Google (GOOG): 50DMA breakdown on a 2.1% loss. I excluded this chart from my chart review, but I should have included it. I covered my short position on GOOG a bit early on the day.
This list is of course a small sample of the carnage today. A lot of momentum stocks fared as badly and worse. Tesla (TSLA) in particular was on my radar. The sell-off today is a continuation of a steady drip that began shortly after Morgan Stanley (MS) sent TSLA rocketing higher with a massive increase in its price target from $153 to $352. It should come as no surprise that the buying generated by the upgrade marked a top. Today, TSLA finally erased all those gains from the upgrade and even sold below its lower-BB. That move is exactly where I was filled for call options (I should have done something similar with LNKD). The move also happened to provide a “close enough” test of 50DMA support. The trade had dual rationale, and the stock delivered on schedule with a bounce that almost recovered TSLA back to its lower-BB. I sold the call options there.
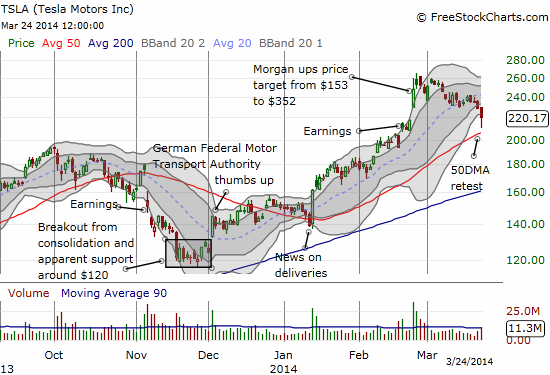
If the Morgan upgrade is worth anything, TSLA’s roundtrip should attract dip-buyers and setup a retest of all-time highs at some point. I am not sure yet whether I will try to make a play. Certainly if the market returns to bullishness, TSLA would again become a great trading candidate on the long side.
The ability of sellers to push momentum stocks below their lower-BBs was one of the more notable features of today’s sell-offs. To me, these kinds of drops confirm that sellers are finally getting serious. When momentum dies, the surfers tend to try running for the safety of the shores at the same time. The route downward is not straight because there are plenty of people, including bears, who regret missing the previous ride and characterize these dips as buying opportunities. If momentum was the main driver before, these bounces do not generate any new momentum or breakouts. DDD is an early example of this pattern: the stock broke down post-earnings, and buyers soon rushed in. The rally ended cold at natural resistance, leading to a fresh breakdown. Thus, the trading call remains biased short but to fade rallies. As I noted in the last T2108 Update, I made Friday an exception because my observation told me that a bail-out moment was around the corner.
Note that I focused today’s trading on closing out short positions and initiating some longs on over-extended drawdowns. In addition to the trades below, I closed almost all of my remaining put options on ProShares Ultra S&P 500 (SSO). I am not aggressive because I am STILL waiting for the currency market to confirm weakness. Instead, the Australian dollar has shown nothing but stubborn resilience. The Aussie versus the Japanese yen (AUD/JPY) seemed completely oblivious to today’s carnage. In fact, it moved HIGHER on the day. This resilience should keep all bears on their toes.
Daily T2108 vs the S&P 500
")
Black line: T2108 (measured on the right); Green line: S&P 500 (for comparative purposes)
Red line: T2108 Overbought (70%); Blue line: T2108 Oversold (20%)
Weekly T2108

*All charts created using freestockcharts.com unless otherwise stated
Related links:
The T2108 Resource Page
Expanded daily chart of T2108 versus the S&P 500
Expanded weekly chart of T2108
Be careful out there!
Full disclosure: long SSO puts, net short Australian dollar, long SSO puts, long LNKD call options, long NFLX put spread, short SBUX, long ITB call options