
As promised, here is a cornucopia of charts. To me, this is still just a small sample of the very enticing and intriguing charts popping up everywhere as more evidence builds that some kind of top is getting printed in the stock market. In particular, note my selection of momentum charts that are wobbling, weakening, or just downright breaking down.
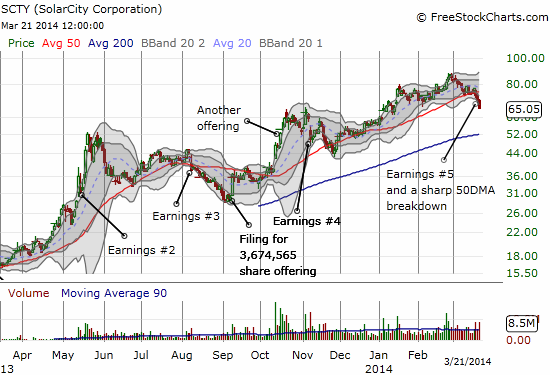
SolarCity (SCTY) is THE darling of the solar industry right now. Fortunes seem to be slowly shifting in favor of First Solar (FSLR). Sure SCTY has broken down below its 50-day moving average (DMA) in earlier swoons, but this time is a bit different with three straight days of high volume selling. Also disturbing is that the market has initially reacted poorly to the last three earnings reports. I am guessing that something other than earnings (say speculative traders) has generated the last two recoveries. Let’s see if those speculators show up soon to save SCTY once more…
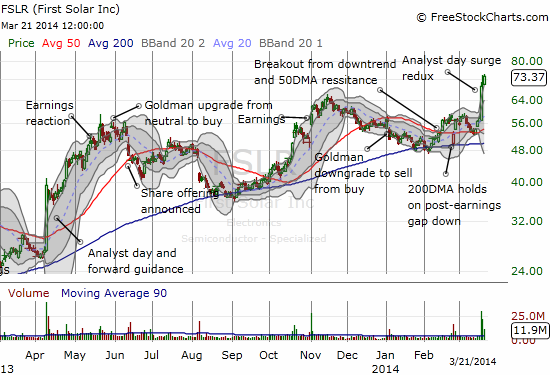
The chart of First Solar (FSLR) says it all: a strong chart with a breakout with the last three days of strength exactly the opposite of SCTY’s weakness. Consider this an “intriguing” exception to the abounding bearishness…
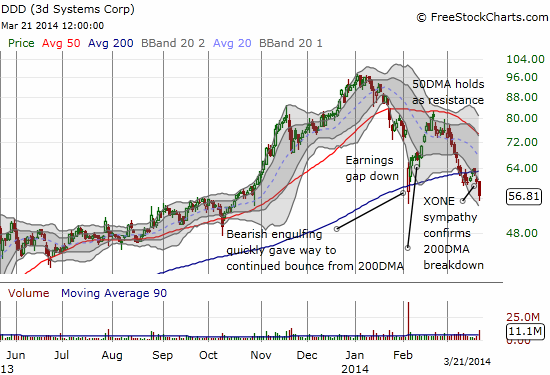
3d Systems Corp (DDD) has been a darling among darling 3D printing stocks. The last earnings report generated a severe breakdown. Speculators bought the dip but ran out of gas at 50DMA resistance. On Thursday, March 20, 2014, a poor post-earnings response from The ExOne Company (XONE) generated just enough grease to complete a fresh breakdown from the 200DMA. DDD has now made a complete post-earnings roundtrip. I used Friday’s selling to lock in profits on put options. I am now waiting to see whether DDD can generate a confirmed post-earnings low.
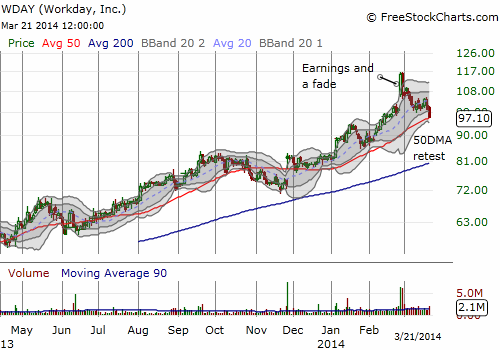
Workday (WDAY) has had an incredible run since its IPO on October 12, 2012. At the time, it opened at $47.85 after pricing its IPO for $28/share. This is one of the more strange momentum stocks around. The company has yet to turn in a profit. Year-over-year revenue growth is extremely strong, but it is decelerating a bit. (All data from briefing.com). With a price-to-sales ratio of 37.4, revenue growth needs to accelerate to justify this kind of momentum. The day of reckoning may have finally arrived with the major fade after WDAY’s last earnings report. It looks like a classic climactic top with the last eager buyers rushing into the stock. The first test of this top comes now with a 50DMA retest…
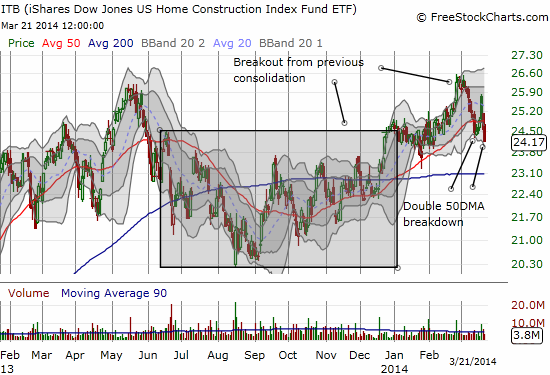
The breakout is officially over for iShares US Home Construction (ITB). With the 50DMA breaking down, at best, I think ITB can retest recent highs in the short-term. Just as I found it heard to get bearish on the stock market while ITB was rallying and breaking out, I find it difficult to think of a market rally while ITB is breaking down. I think ITB is now a decent hedge for other bearish positions.
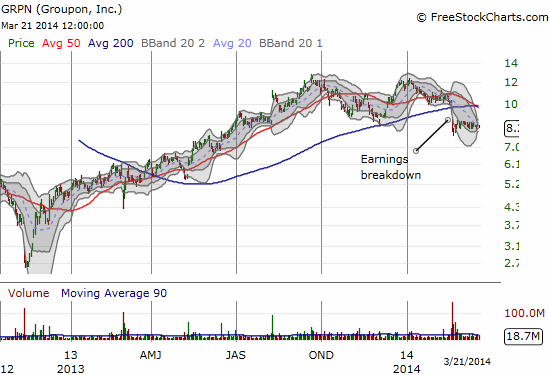
Groupon.com (GRPN) was a great “January effect” pick back in November/December, 2012. I never imagined the rally would run so long and far. Earnings a month ago delivered the stock’s first trip below its 200DMA in a year. The stock has spent a month consolidating. I strongly suspect the downward momentum will resume by the time the downward sloping 50DMA (and then the 200DMA) catch up to the stock.
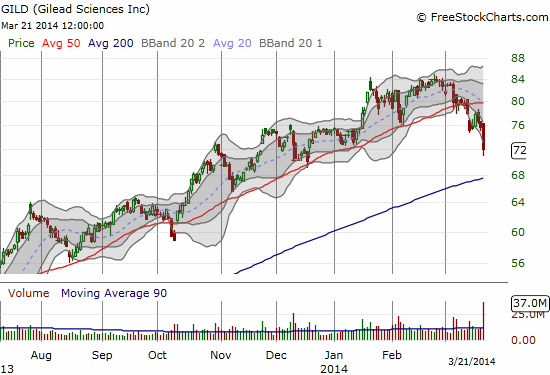
Gilead Sciences (GILD) has had one of those runs momentum traders dream about. Since a post-recession bottom in 2010 around $16/share, GILD has soared in four years to $72.07. More importantly, the stock has traveled nearly straight up since early 2012. Now, the stock is in a bit of danger with a 50DMA breakdown on March 13th confirmed by follow-through selling a week later on news of “a letter to GILD from a lawmaker.” The 200DMA looks like it will quickly receive a retest.
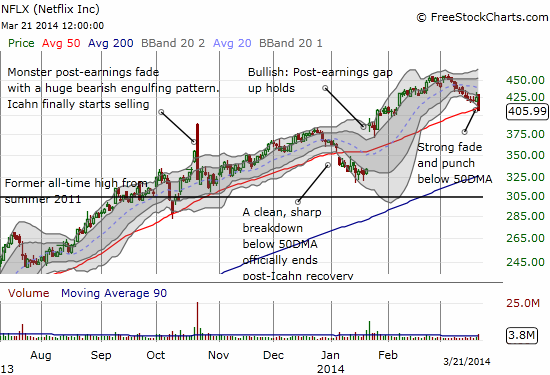
Netflix (NFLX) was a great bullish pick in early February. The call spread I picked out worked very well in the next month. However, I was very late in recognizing the trade had ended and failed to lock in my profits. With the call spread going out worthless in last Friday’s expiration, I turned bearish with a put spread in recognition of the growing downside momentum. This downtrend took on a new ugliness with an out-sized bearish engulfing pattern that took NFLX below its 50DMA.
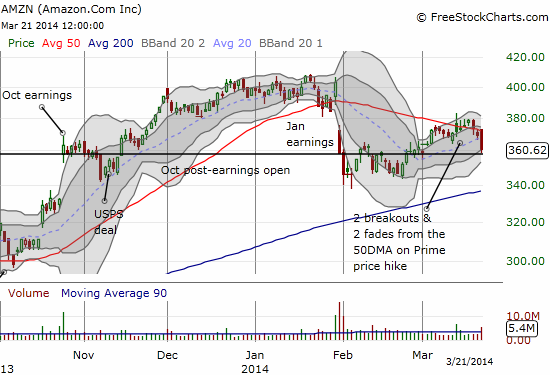
Amazon.com (AMZN) consolidated after its post-earnings gap down before putting on a valiant attempt at recovery. This comeback stalled at the 50DMA and may have hit a climax with the announcement of a price hike in Amazon Prime from $79 to $99. It was fascinating watching the narrative on the price hike change according to the stock direction. With a 2.3% drawdown on Friday, it seems resistance has been confirmed and AMZN is, surprisingly, already back to a bearish look.
The struggles with LinkedIn (LNKD) continue. Of all the momentum stocks I follow as indicators, LNKD’s top is just about the earliest. The stock has churned in a wide range but lower since September, 2013. It has followed its 50DMA downward since then. The most recent demonstration of this failure happened on Friday. For my latest trade on LNKD, I have taken a hedged approach: April call spread and weekly put options.
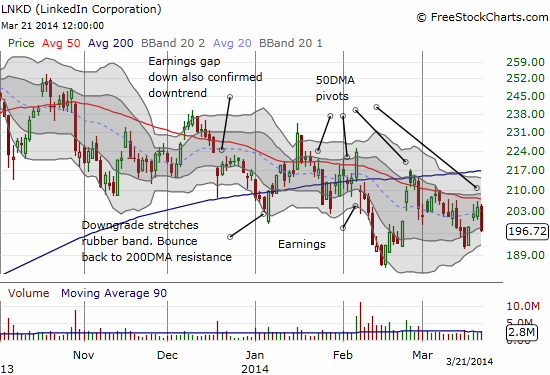
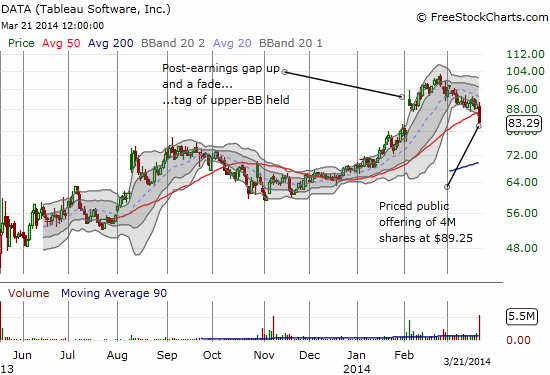
Tableau Software, Inc. (DATA) catches my interest here because it features a public offering of shares that actually did not cause a huge rally in the stock. So often in the past year or more, the market has greeted the extra liquidity/dilution of more stock on hot IPOs and momentum stocks as buying opportunities. In the case of DATA, not only did buyers fail to show up, but sellers instead took the stock well below the offering price of $89.25. I am not going to say that this move signals a change in sentiment or attitude or even recognition that these companies are likely offering up more shares because they think the stock is at best fairly valued. But it IS a start…
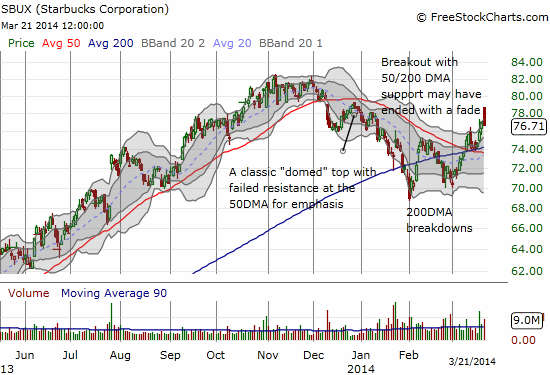
I featured Starbucks (SBUX) again on Wednesday, March 19th. The stock continued its breakout in the next two days but it seems to have already ended on a strong and ominous fade on Friday. The high of the day nearly coincided with presumed resistance from the December failure at the 50DMA which convinced me that SBUX had printed a topping pattern. Another lower close will pretty much confirm a top for me.
Be careful out there!
Full disclosure: long ITB calls, long NFLX put spread, short AMZN, long LNKD call spread and put options,