
(T2108 measures the percentage of stocks trading above their respective 40-day moving averages [DMAs]. It helps to identify extremes in market sentiment that are likely to reverse. To learn more about it, see my T2108 Resource Page. You can follow real-time T2108 commentary on twitter using the #T2108 hashtag. T2108-related trades and other trades are posted on twitter using the #120trade hashtag)
T2108 Status: 65.5%
VIX Status: 15.12
General (Short-term) Trading Call: Short (fade rallies)
Active T2108 periods: Day #177 over 20%, Day #23 over 60% (overperiod), Day #1 under 70% (underperiod)
Reference Charts (click for view of last 6 months from Stockcharts.com):
S&P 500 or SPY
SDS (ProShares UltraShort S&P500)
U.S. Dollar Index (volatility index)
EEM (iShares MSCI Emerging Markets)
VIX (volatility index)
VXX (iPath S&P 500 VIX Short-Term Futures ETN)
EWG (iShares MSCI Germany Index Fund)
CAT (Caterpillar).
Commentary
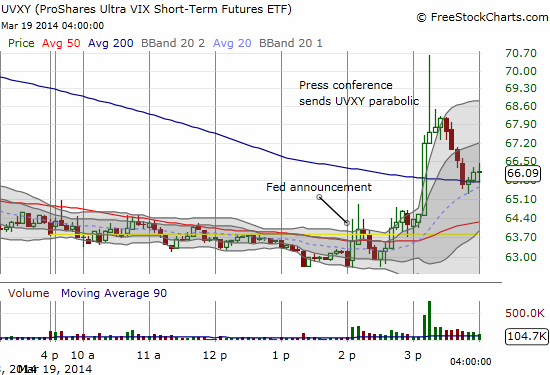
The Federal Reserve delivered the volatility I expected…but I failed to execute on locking up the profits in my shares of ProShares Ultra VIX Short-Term Fut ETF (UVXY). However, I think the latest run has not reached a high just yet as the market seems to need to adjust. Based on just the headlines and reaction to the Fed’s statement in financial markets, especially bonds and currencies, it seems that, for whatever reason, traders and investors were holding out hope that the Fed would do or say something more dovish. The key will probably be in the way the week closes. The chart below shows how UVXY went parabolic on an intraday basis…it HAD to pull back and cool off!
The presumed top in the S&P 500 (SPY) held firm today. The small pullback was not a definitive one. With T2108 tumbling out of overbought conditions again, it is a close confirmation. I noted in the last T2108 Update that the current churn in and out of overbought conditions is very rare. If T2108 pops back into overbought conditions in the next week or so, we will be in even more rarefied air. With the VIX pulling back from its highs, it closed just below the persistent 15.35 pivot. So, while I am positioning for more follow-through selling, I am bracing for another one of those classic bull market buyer’s reversals.
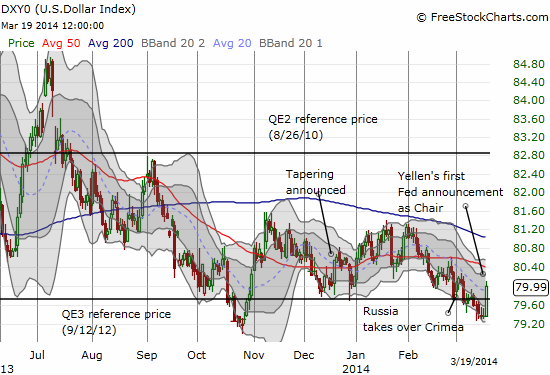
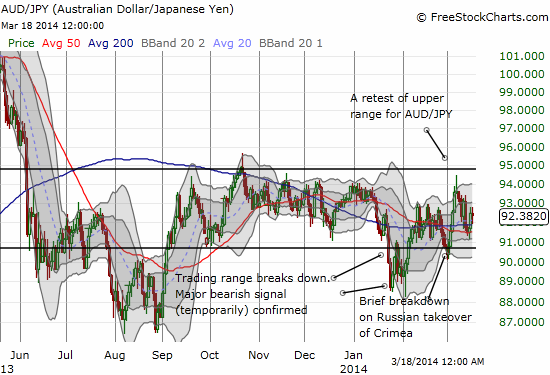
Moreover, the U.S. dollar index (UUP) had a tremendous day. Given previous observations, I could consider this rally a non-confirmation of the selling. It is a close call because the Fed meeting today distorts the signal. The further away we move from today, the more confident I will get again in trying to tease out any meaning in the correlation (or lack thereof) between currency movements and stock market movements. Also notable was the stalemate in the Australian dollar versus the Japanese yen (AUD/JPY).
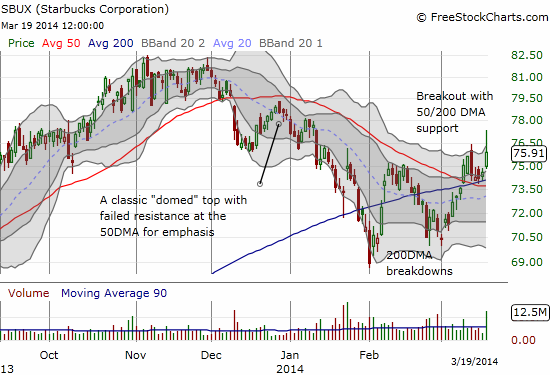
I close with another chart review of Starbucks (SBUX). I happened to be watching CNBC early this morning (a RARE “treat”) and caught a segment with Jim Cramer interviewing the CEO of Starbucks, Howard Schultz. It was one of those classic moments when it seemed like the TV offered an easy, lay-up trade that seemed so easy, I dared not try it. Sure enough though, the market bid SBUX up throughout and after the interview.
Schultz talked about the growth opportunities for SBUX in tea and mobile payments. He also debunked concerns over coffee prices (who knew that coffee would be such a small input for a coffee shop?!). Turns out dairy is more of a concern than coffee.
Anyway, the end result is a stock that looks like it REALLY wants to break out. The rally today took the stock well above the upper-Bollinger Band (BB). If had been paying attention, I could have recognized the fresh shorting opportunity that move presented. As it stands, the stock is behaving very well…as if it is comfortable with 50 and 200DMA support. If the general stock market manages to rally again, SBUX could launch ever higher, putting the short trade in even greater peril of ending.
Daily T2108 vs the S&P 500
")
Black line: T2108 (measured on the right); Green line: S&P 500 (for comparative purposes)
Red line: T2108 Overbought (70%); Blue line: T2108 Oversold (20%)
Weekly T2108

*All charts created using freestockcharts.com unless otherwise stated
Related links:
The T2108 Resource Page
Expanded daily chart of T2108 versus the S&P 500
Expanded weekly chart of T2108
Be careful out there!
Full disclosure: long SSO puts, long UVXY shares; short SBUX; net long the U.S. dollar