
(T2108 measures the percentage of stocks trading above their respective 40-day moving averages [DMAs]. It helps to identify extremes in market sentiment that are likely to reverse. To learn more about it, see my T2108 Resource Page. You can follow real-time T2108 commentary on twitter using the #T2108 hashtag. T2108-related trades and other trades are posted on twitter using the #120trade hashtag)
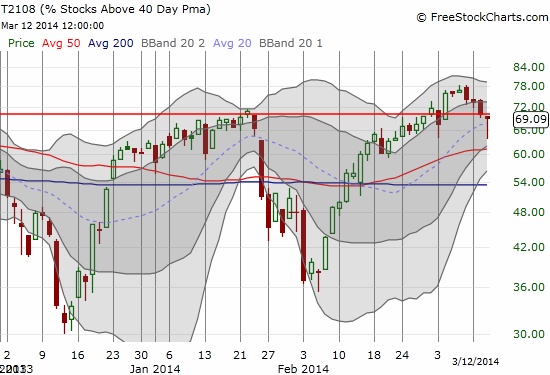
T2108 Status: 69.1% (ends overbought period at 6 days)
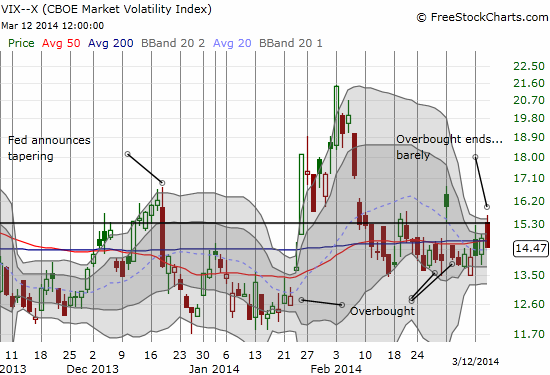
VIX Status: 14.5 (slight DECLINE from previous day)
General (Short-term) Trading Call: Short (marginally)
Active T2108 periods: Day #172 over 20%, Day #18 over 60%, Day #1 under 70% (underperiod)
Reference Charts (click for view of last 6 months from Stockcharts.com):
S&P 500 or SPY
SDS (ProShares UltraShort S&P500)
U.S. Dollar Index (volatility index)
EEM (iShares MSCI Emerging Markets)
VIX (volatility index)
VXX (iPath S&P 500 VIX Short-Term Futures ETN)
EWG (iShares MSCI Germany Index Fund)
CAT (Caterpillar).
Commentary
One of the most remarkable features of this bull market is the propensity of buyers in rallies to quickly and eagerly show up on almost every intraday dip in the market. Today’s display was one of the more dramatic because it marked a potentially critical juncture for the S&P 500 (SPY) with T2108 closing right on the edge of overbought territory yesterday. The S&P 500 fell to the rising 20-day moving average (DMA) before staging another classic bull market buyer’s reversal. It was enough to close the S&P 500 with the tiniest of gains. However, it did NOT return T2108 to overbought status.
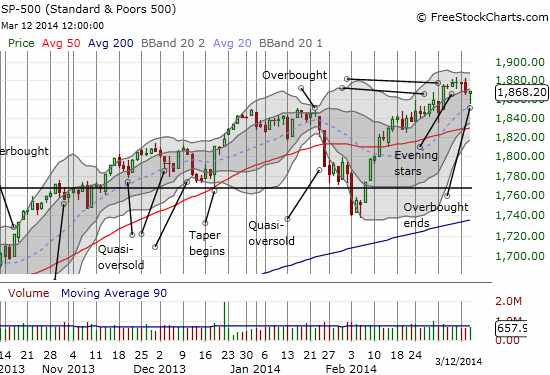
By rule, I have switched the trading call to short. This change is of course quite marginal and thus, unfortunately, vulnerable to yet more market churn. I have not yet acted on this change. Instead, I will wait to see whether the S&P 500 can at least break today’s low. Since the biggest downdraft on the day was just -0.6%, I realize I am not asking for much…except this is a stubbornly strong bull market.
Interestingly, the volatility index, the VIX, rallied right into the standard pivot point before getting faded. My (hedging) shares in ProShares Ultra VIX Short-Term Fut ETF (UVXY) snapped back to profitability for a hot minute, only to disappoint. This position is putting my head on a swivel, and I am very close to just tossing it overboard before the inevitable slide to successive all-time lows begins again.
In the last T2108 Update, I ran through a whole host of bearish signals awaiting confirmation from other signals. The U.S. dollar remains one of the most interesting as it has recently served as a reliable non-confirmation of sell-offs. Today it closed at a fresh 5-month closing low yet the stock market still managed to rally. If the dollar continues to sell-off, it is not likely the stock market will be able to continue it divergence.
Finally, Doug Kass yet again provided for me a great sample/example of the true underlying timidness and tenuousness of bearish sentiment. After going short the NASDAQ yesterday using QQQ, he jumped on the market’s tiny dip to go net long 5%, calling it “baby steps.” His tweet implied that he was preparing for an extended rally and saw this dip as a potential way to finally get on board the train (or steamroller). In the end, the fractional rally was good enough for him to close up shop and go back to neutral and then back to net short. It is next to impossible to track his net positioning since he is not consistent in announcing the end of trades, but I think the announcement of entries are informative enough. And so goes the short half-life life of (actualized) bearish sentiment…
Moved to 5% net long this morning. Baby steps. http://t.co/Fhkrw7h9bS
— Douglas Kass (@DougKass) March 12, 2014
Back reshorting QQQs at 90.40 and back to market neutral.
— Douglas Kass (@DougKass) March 12, 2014
Back reshorting IWM at 118.17 – bringing me back net short. $IWM
— Douglas Kass (@DougKass) March 12, 2014
Daily T2108 vs the S&P 500
")
Black line: T2108 (measured on the right); Green line: S&P 500 (for comparative purposes)
Red line: T2108 Overbought (70%); Blue line: T2108 Oversold (20%)
Weekly T2108

*All charts created using freestockcharts.com unless otherwise stated
Related links:
The T2108 Resource Page
Expanded daily chart of T2108 versus the S&P 500
Expanded weekly chart of T2108
Be careful out there!
Full disclosure: long SSO puts and calls, long UVXY shares, net long U.S. dollar