
(T2108 measures the percentage of stocks trading above their respective 40-day moving averages [DMAs]. It helps to identify extremes in market sentiment that are likely to reverse. To learn more about it, see my T2108 Resource Page. You can follow real-time T2108 commentary on twitter using the #T2108 hashtag. T2108-related trades and other trades are posted on twitter using the #120trade hashtag)
T2108 Status: 70.0% (6th overbought day)
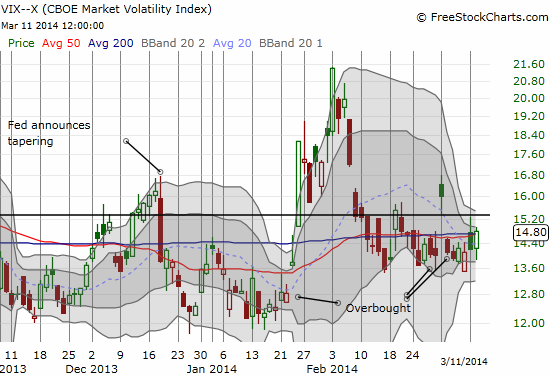
VIX Status: 14.8
General (Short-term) Trading Call: Long (just barely! See below)
Active T2108 periods: Day #171 over 20%, Day #17 over 60%, Day #6 over 70% (overbought/overperiod)
Reference Charts (click for view of last 6 months from Stockcharts.com):
S&P 500 or SPY
SDS (ProShares UltraShort S&P500)
U.S. Dollar Index (volatility index)
EEM (iShares MSCI Emerging Markets)
VIX (volatility index)
VXX (iPath S&P 500 VIX Short-Term Futures ETN)
EWG (iShares MSCI Germany Index Fund)
CAT (Caterpillar).
Commentary
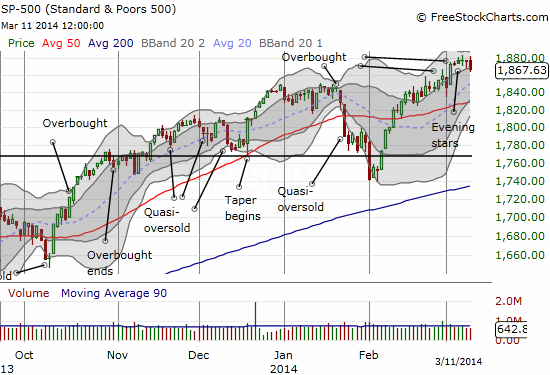
Suddenly, things look a lot bearish than they did just two days ago. A sequence of growing yellow flags have my attention now that T2108 is on the verge of ending its latest rendezvous with overbought territory. T2108 closed Tuesday’s trading neatly at the border of overbought territory (70%). A close below 70% flips the trading call back to bearish. The current trading bias on the long side is extremely tenuous and is simply a residual of the trading strategy anticipating an extended overbought rally. I am currently in the second round of playing the strategy with call options on ProShares Ultra S&P500 (SSO). It was looking pretty good after the S&P 500 pulled off another one of those reversals of its lows.
NOW, however, danger signals are growing. The S&P 500 (SPY) only lost 0.5%, but it comes after four days of hesitant trading that may have gradually sapped the market’s momentum. Another day of selling would confirm these “dojis” as “evening stars” that mark the end of a trend.
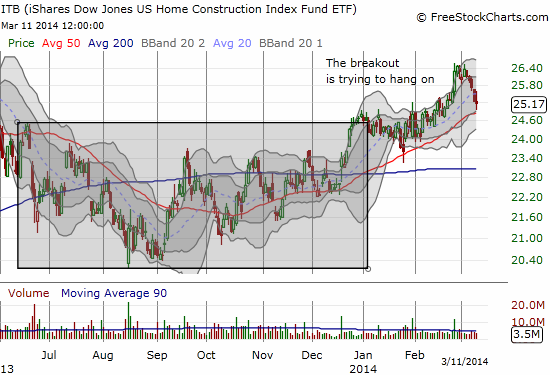
I watch home builders a lot and was earlier encouraged by a breakout from a period of consolidation. However, that breakout is close to ending. iShares US Home Construction (ITB) has closed down five straight days since its recent breakout peak, thus serving as a potential leading signal for the stalled momentum in the general stock market. This selling has occurred despite strong data on new home sales and employment in residential construction. ITB is now retesting support from the uptrend represented in the 50-day moving average (DMA).
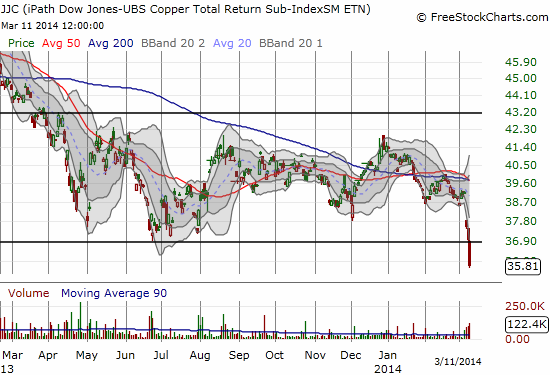
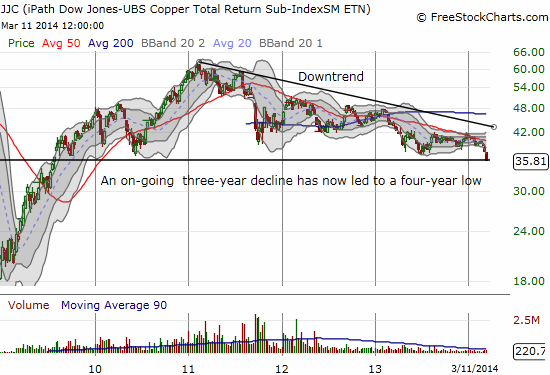
In the middle of the slide for homebuilders, copper prices took a fresh and sudden plunge. On Friday, March 7th, copper prices dropped sharply. Two days of more selling later and copper futures are now at four-year lows. The palpable concern is a combination of growth worries and the unwind of carry trades related to collateral on loans in China. I use iPath DJ-UBS Copper TR Sub-Idx ETN (JJC) to show the copper-related trading action.
Alongside the drop in copper, iron ore prices have been steadily dropping this year. Iron ore is now down 20% year-to-date. The usual suspects appear as explanations: an oversupply of iron ore driven by weak demand and credit-tightening, this time impacting struggling steel mills. A new explanation has come in the form of China’s recent pollution abatement efforts. China is cutting steel production capacity to reduce air pollution around Beijing. Of course, China can afford to take this action if core demand for steel is weak anyway. The on-going decline in iron ore prices helped drive the February report on the Reserve Bank of Australia’s (RBA) index of commodity prices to a 12% year-over-year loss (in SDR terms) and near 4-year lows.
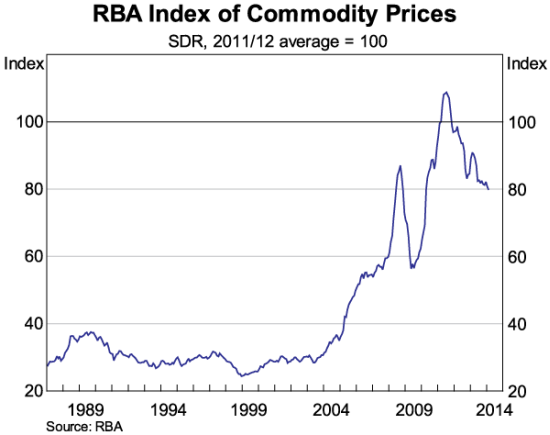
Source: Reserve Bank of Australia
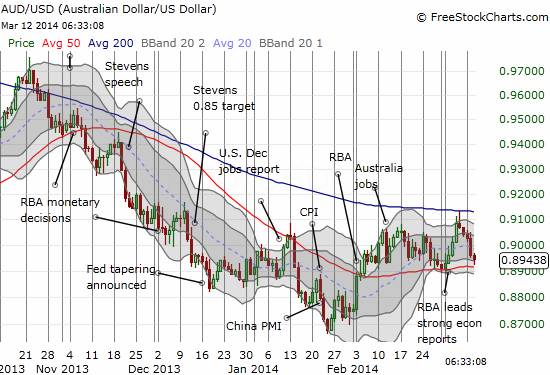
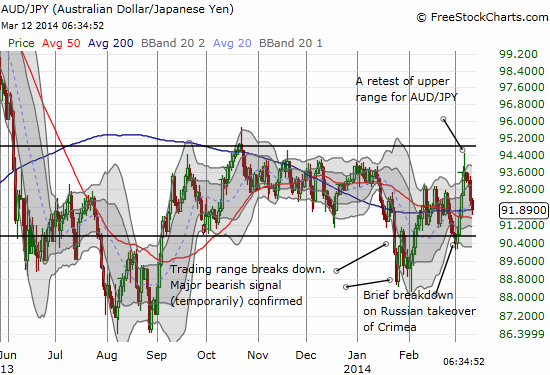
It seems the decline in copper prices was the final straw for the Australian dollar. After rallying on a string of strong economic reports last week, the Australian dollar (FXA) hit a brick wall on Friday. Against the U.S. dollar, the Australian dollar faded perfectly from resistance at the 200DMA and has nearly erased all its gains from the strong economic reports. Even more important is the indicator I have followed in the form of the Australian dollar versus the Japanese yen. The fade on Friday caused AUD/JPY to retreat sharply from a potentially bullish breakout. The currency pair has returned to the middle of its extended range. A breakdown in AUD/JPY would serve as a strong confirmation of growing bearish signals.
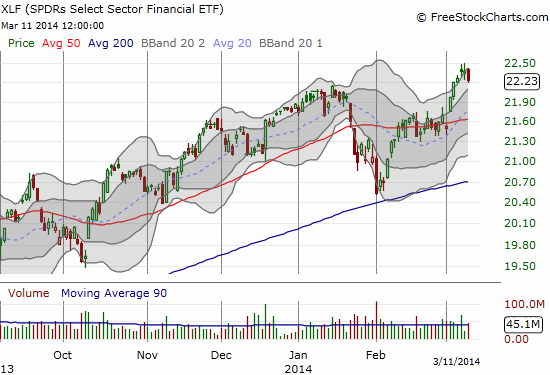
Financials are often cited as a big market tell. Through all of the weakness cited above, financials remained resilient, even out-performing the S&P 500. Like the S&P 500, the uptrend in Financial Select Sector SPDR (XLF) is well-intact. Tuesday’s drop was very small and nowhere close to confirming the growing collection of bearish signals. Tuesday’s close was not even below the former 52-week (and 6-year) closing high set two months ago. So, add this to AUD/JPY as a non-confirmation of growing bearishness.
The volatility index (VIX) stayed firm as the stock market churned but it did not burst higher on Tuesday. In fact, it barely managed to close above the intra-day high from the previous day. The consolidation continues from the one-burst that began the month. A new bout of market bearishness will likely come with volatility returning at least to those levels.
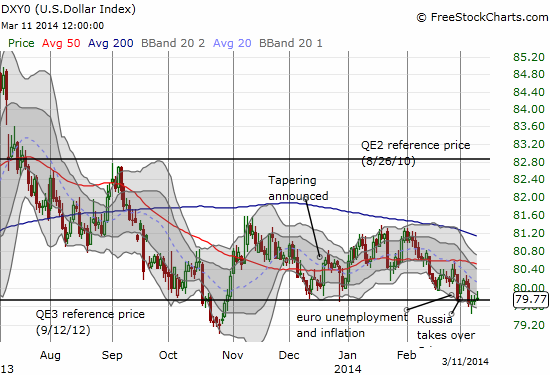
Finally, the U.S. dollar has not confirmed a sell-off yet. I have pointed out in earlier posts how the lack of downward movement in the U.S. dollar has served as a non-confirming signal for bouts of market selling. Currently, the U.S. dollar is holding a support line and marginally recovering from last Thursday’s plunge. This is the biggest of the non-confirming signals so far.
Taken together, these charts may look like a blurry cocktail of signals. Moreover, what was once a reliable correlation or relationship can turn silent in another moment as the markets are fluid and dynamic. T2108 is the bottom-line to remember for trading purposes here. Once the overbought period ends, I look to the confirming signals to judge the potential “seriousness” of the bearish signal. All the market needs is an excuse to sell. I think the market has sufficient excuses in weakening home builders and falling commodity prices and the related “trouble in China” these declines suggest. Thus, these signals look like leading indicators just waiting for confirmation from the holdouts listed above. Stay tuned…
Daily T2108 vs the S&P 500
")
Black line: T2108 (measured on the right); Green line: S&P 500 (for comparative purposes)
Red line: T2108 Overbought (70%); Blue line: T2108 Oversold (20%)
Weekly T2108

*All charts created using freestockcharts.com unless otherwise stated
Related links:
The T2108 Resource Page
Expanded daily chart of T2108 versus the S&P 500
Expanded weekly chart of T2108
Be careful out there!
Full disclosure: long SSO puts and calls, long UVXY shares, net short the Australian dollar, net long Japanese yen, long ITB call options