
(T2108 measures the percentage of stocks trading above their respective 40-day moving averages [DMAs]. It helps to identify extremes in market sentiment that are likely to reverse. To learn more about it, see my T2108 Resource Page. You can follow real-time T2108 commentary on twitter using the #T2108 hashtag. T2108-related trades and other trades are posted on twitter using the #120trade hashtag)
T2108 Status: 74.2% (4th overbought day)
VIX Status: 14.1
General (Short-term) Trading Call: Long
Active T2108 periods: Day #169 over 20%, Day #15 over 60%, Day #4 over 70% (overbought/overperiod)
Reference Charts (click for view of last 6 months from Stockcharts.com):
S&P 500 or SPY
SDS (ProShares UltraShort S&P500)
U.S. Dollar Index (volatility index)
EEM (iShares MSCI Emerging Markets)
VIX (volatility index)
VXX (iPath S&P 500 VIX Short-Term Futures ETN)
EWG (iShares MSCI Germany Index Fund)
CAT (Caterpillar).
Commentary
My first round at playing an extended overbought rally was a small success. I started a small tranche of ProShares Ultra S&P500 (SSO) call options on the first dip of the overbought period. I promptly sold them after Friday’s higher than expected jobs number failed to inspire a gap up or even a strong open. A limit order to buy into any dip on the day failed to execute. Going forward, I will continue the aggressive dip-buying until it fails to work.
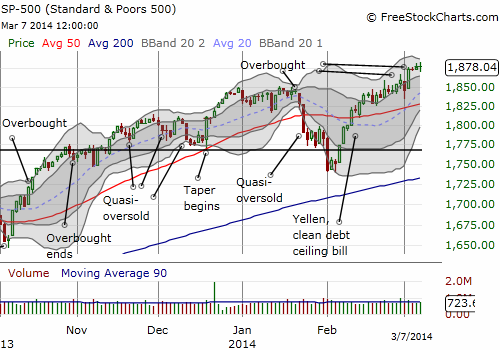
While the S&P 500 (SPY) managed to close at a new all-time high (marginally), T2108 took a dip to close the week at 74.2%. This mild bearish divergence is a yellow flag. The VIX is also hanging tight. After Tuesday’s drubbing, the volatility index has closed at almost the same level the last three days.
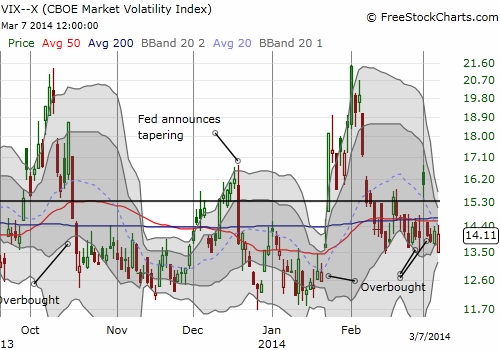
It is hard to know exactly what the VIX stabilization means, if anything. But combined with a tick downward in T2108, it makes sense to stay on the lookout for a sudden drop out of overbought conditions. Without such a drop, the trading call remains bullish.
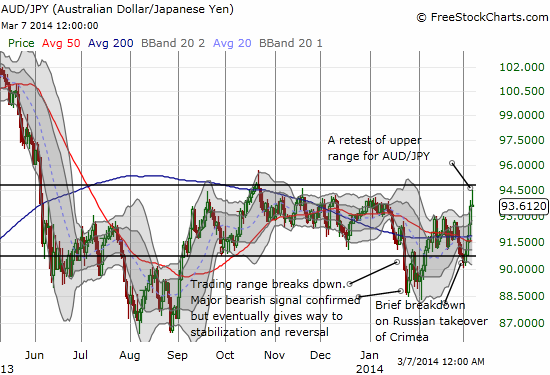
Almost in the bull’s corner is AUD/JPY, the Australian dollar (FXA) versus the Japanese yen (FXY). On Friday, AUD/JPY surged and essentially tested the upper portion of the presumed trading range. I have argued in several places that a breakdown/out of the AUD/JPY trading range would carry significance for the stock market. Breakdowns have worked like a charm as well as bounces out of the breakdown. Bulls can see Friday’s retest as the first phase of an eventual breakout. Bears can see Friday’s failed retest as a signal the rally has finally ended. This coming week’s follow-through should be telling. Note that I took this opportunity to finally close out my long AUD/JPY position. I will slowly rebuild it on dips as a trading range play and hedge on my net short position against the Australian dollar.
Now some quick chart reviews:
The bond rally for 2014 may have finally ended. iShares 20+ Year Treasury Bond (TLT) put in an ominous double-top formation and is breaking down below its 200 and 50DMAs.
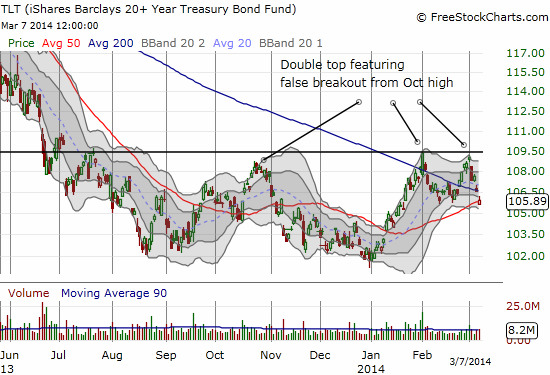
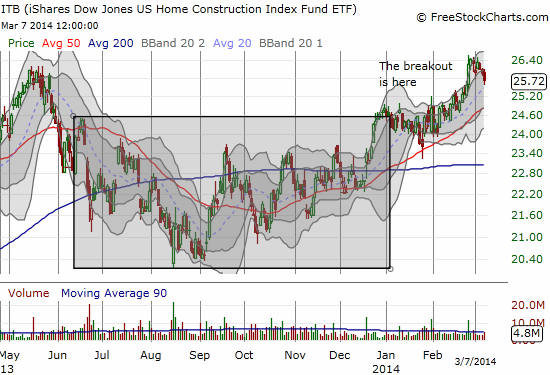
Higher rates could be re-generating fears for housing. Since I think an extended rally for home builders will occur alongside a general stock market rally, I loaded up on some call options on iShares US Home Construction (ITB). This is a play on the 20DMA holding as general support.
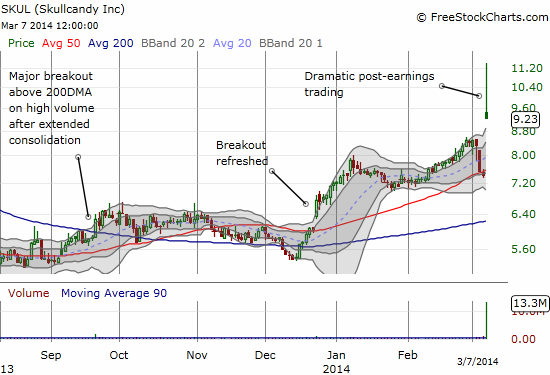
I conclude this short update with the incredible post-earnings chart of Skullcandy. At the time of writing, I have a pending post with Seeking Alpha discussing the earnings that generated the surge and fade on Friday. At one point, SKUL was over 50% up for the day! I always make the point that stocks gapping well above or below the upper-Bollinger Band (BB) should be faded. In the case of SKUL, a short position would have experienced a wild ride, but in the end would have been profitable almost no matter when the fade was entered: SKUL closed at its low of the day. It never even occurred to me to try a fade because I was just looking for a point to lock in profits on my long position…
Daily T2108 vs the S&P 500
")
Black line: T2108 (measured on the right); Green line: S&P 500 (for comparative purposes)
Red line: T2108 Overbought (70%); Blue line: T2108 Oversold (20%)
Weekly T2108

*All charts created using freestockcharts.com unless otherwise stated
Related links:
The T2108 Resource Page
Expanded daily chart of T2108 versus the S&P 500
Expanded weekly chart of T2108
Be careful out there!
Full disclosure: long SSO puts and calls, long UVXY shares, net short the Australian dollar, net long Japanese yen, long ITB call options, long put and call options on TLT