
(T2108 measures the percentage of stocks trading above their respective 40-day moving averages [DMAs]. It helps to identify extremes in market sentiment that are likely to reverse. To learn more about it, see my T2108 Resource Page. You can follow real-time T2108 commentary on twitter using the #T2108 hashtag. T2108-related trades and other trades are posted on twitter using the #120trade hashtag)
T2108 Status: 76.0% (1st overbought day after 1-day overbought period 2 days ago)
VIX Status: 16.0
General (Short-term) Trading Call: Long
Active T2108 periods: Day #166 over 20%, Day #12 over 60%, Day #1 over 70% (overbought/overperiod)
Reference Charts (click for view of last 6 months from Stockcharts.com):
S&P 500 or SPY
SDS (ProShares UltraShort S&P500)
U.S. Dollar Index (volatility index)
EEM (iShares MSCI Emerging Markets)
VIX (volatility index)
VXX (iPath S&P 500 VIX Short-Term Futures ETN)
EWG (iShares MSCI Germany Index Fund)
CAT (Caterpillar).
Commentary
Even Cyprus generated more fear and hand-wringing out of the market than Ukraine versus Russia.
So it turns out the latest trip to overbought conditions is NOT likely to unfold like the trip in late January or even like other recent episodes of quick trips to or close to overbought conditions. In what now qualifies as a mere burp, yesterday’s sharp drop out of overbought conditions has now itself been reversed and then some. The S&P 500 (SPY) surged 1.5% to another fresh all-time high. T2108 closed at a 4-month high at 76%.
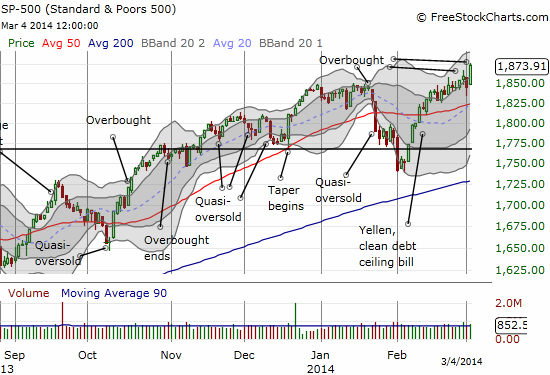
Following the script I laid out in the last T2108 Update, a close by the S&P 500 at this all-time high in overbought conditions flips my trading bias to bullish. This trading call is in-line with my revised approach to trading overbought conditions. I was tempted to launch into a tranche of SSO call options right away but instead decided to wait to see the close confirm the bullish bias. Given T2108 is already pretty high, I expect to have at least a day or two to reposition myself bullishly.
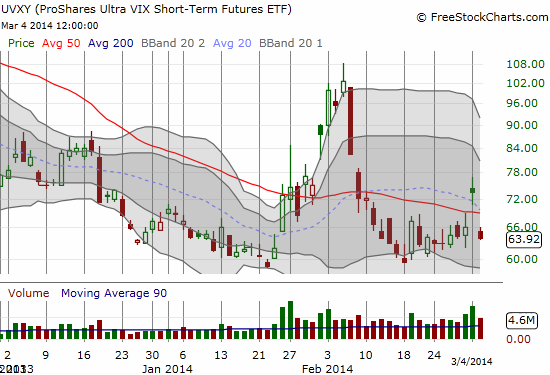
In the meantime, of course I lamented not taking the profits in ProShares Ultra VIX Short-Term Fut ETF (UVXY) when I had them. Since the bottom is still holding for now, I decided to double down on my shares and keep tIhe same stop (a fresh all-time low…which is of course inevitable, just a matter of timing) and lowered the upside price target to $88 from $92. I will keep this as a hedge in case somehow, bears manage to convince the S&P 500 steamroller to turn around.
Without the Ukraine catalyst and without economic numbers souring the mood, bears are certainly left scratching their heads and stretching for something, anything to mean the market is too high. I found a good one from unrepentant bear Doug Kass:
The last time the Russell Index rose by +3% (and to a new 52 week high) was March 1, 2000.
Buyer beware. $IWM
— Douglas Kass (@DougKass) March 4, 2014
He did not respond when I asked whether this meant he would double down on is call options on ProShares UltraShort Russell2000 (TWM) (triple inverse the Russell 2000). However, I could tell from his responses to other tweeters that this seemingly ominous tweet was more bait than anything else; an observation of a coincidence that is married to hope.
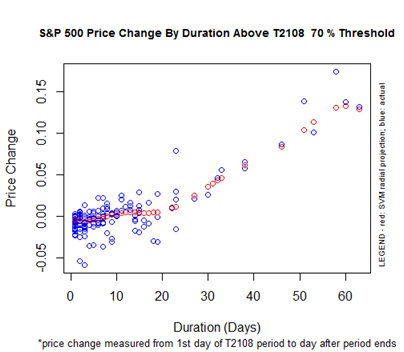
Instead of fighting the trend, it makes much more sense to join the trend until it ends. Per the revised overbought trading strategy, that time will not come until T2108 falls from overbought conditions OR it prints some classic bearish pattern…whichever comes first and further conditioned on the historical patterns of overbought conditions (reminder below). Stay tuned!
Daily T2108 vs the S&P 500
")
Black line: T2108 (measured on the right); Green line: S&P 500 (for comparative purposes)
Red line: T2108 Overbought (70%); Blue line: T2108 Oversold (20%)
Weekly T2108

*All charts created using freestockcharts.com unless otherwise stated
Related links:
The T2108 Resource Page
Expanded daily chart of T2108 versus the S&P 500
Expanded weekly chart of T2108
Be careful out there!
Full disclosure: long SSO puts, long UVXY shares