
(T2108 measures the percentage of stocks trading above their respective 40-day moving averages [DMAs]. It helps to identify extremes in market sentiment that are likely to reverse. To learn more about it, see my T2108 Resource Page. You can follow real-time T2108 commentary on twitter using the #T2108 hashtag. T2108-related trades and other trades are posted on twitter using the #120trade hashtag)
T2108 Status: 49.1%
VIX Status: 14.6
General (Short-term) Trading Call: Aggressive traders should short the S&P 500. Tight stop on close above 1800. See caveats below.
Active T2108 periods: Day #110 over 20% (overperiod), Day #1 under 50%, Day #18 under 60%, Day #23 under 70%
Reference Charts (click for view of last 6 months from Stockcharts.com):
S&P 500 or SPY
SDS (ProShares UltraShort S&P500)
U.S. Dollar Index (volatility index)
EEM (iShares MSCI Emerging Markets)
VIX (volatility index)
VXX (iPath S&P 500 VIX Short-Term Futures ETN)
EWG (iShares MSCI Germany Index Fund)
CAT (Caterpillar)
Commentary
The S&P 500 (SPY) closed below 1800, one of the signals I have mentioned triggers a short on the index. However, sellers could not hold the close, and the S&P 500 ended up bouncing neatly off its 20DMA. This uptrend has performed very poorly as support, so I have no strong expectation that it will hold firm this time. However, if the S&P 500 gaps up or opens strongly tomorrow (Wednesday, Dec 4th), I would be inclined to interpret this as confirmation of support and NOT an opportunity to fade.
T2108 quasi-oversold conditions add to the big caveat and the odds for follow-through to the bounce. Even with the bounce from the lows, T2108 is down 15.6% over two days, qualifying for quasi-oversold status. I prefer to play quasi-oversold from bigger (and more dramatic drops) because the error rate for projections of upside tend to be better. See the chart below:
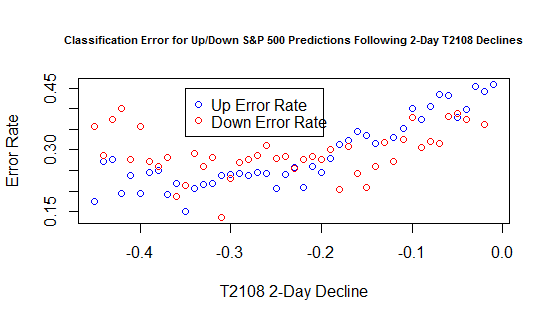
The error rate for the T2108 Trading Model (TTM) is a relatively high 35% at the -15% 2-day drop for T2108, barely worth a trade. The TTM projects a 63% chance of upside tomorrow.
All things considered I think bears are better off standing down UNLESS the S&P 500 moves below today’s low.
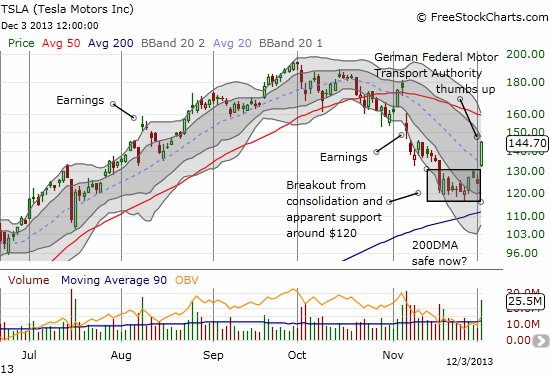
I conclude with this chart of Tesla (TSLA). The stock rocketed higher 16.5% on the heels of several news items:
- The German Federal Motor Transport Authority gave Tesla the all clear
- Morgan Stanley (MS) rated TSLA a top pick
- Jeffries made “positive comments” in response to the news from Germany but lowered its price target to $190 from $210
I indicated in other forums that TSLA could be a key tell for the universe of high-flying, speculative stocks. From today’s reaction, it is clear there remains plenty of buying interest! A huge test is likely coming at the overhead resistance from the 50DMA.
Daily T2108 vs the S&P 500
")
Black line: T2108 (measured on the right); Green line: S&P 500 (for comparative purposes)
Red line: T2108 Overbought (70%); Blue line: T2108 Oversold (20%)
Weekly T2108

*All charts created using freestockcharts.com unless otherwise stated
Related links:
The T2108 Resource Page
Expanded daily chart of T2108 versus the S&P 500
Expanded weekly chart of T2108
Be careful out there!
Full disclosure: long SSO puts and calls; long TSLA shares and puts