
(T2108 measures the percentage of stocks trading above their respective 40-day moving averages [DMAs]. It helps to identify extremes in market sentiment that are likely to reverse. To learn more about it, see my T2108 Resource Page. You can follow real-time T2108 commentary on twitter using the #T2108 hashtag. T2108-related trades and other trades are posted on twitter using the #120trade hashtag)
T2108 Status: 45.5%
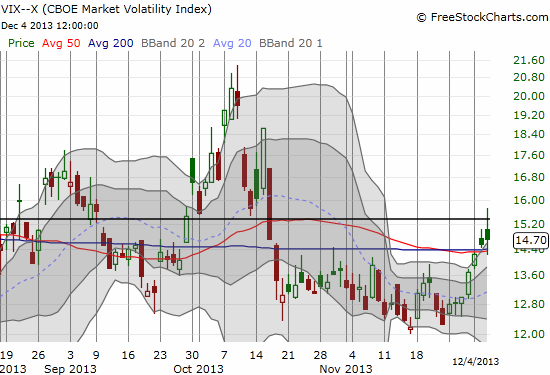
VIX Status: 14.7
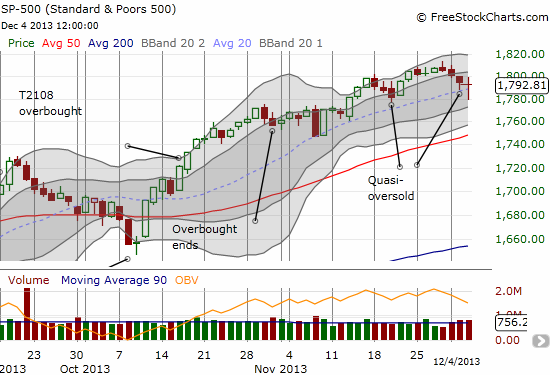
General (Short-term) Trading Call: Aggressive traders stay short. Tight stop remains with close above 1800.
Active T2108 periods: Day #111 over 20% (overperiod), Day #2 under 50%, Day #19 under 60%, Day #24 under 70%
Reference Charts (click for view of last 6 months from Stockcharts.com):
S&P 500 or SPY
SDS (ProShares UltraShort S&P500)
U.S. Dollar Index (volatility index)
EEM (iShares MSCI Emerging Markets)
VIX (volatility index)
VXX (iPath S&P 500 VIX Short-Term Futures ETN)
EWG (iShares MSCI Germany Index Fund)
CAT (Caterpillar)
Commentary
Sellers won another battle of inches but still lack the ammunition to put a convincing mark on the trading action. Yesterday’s quasi-oversold conditions seemed to deliver the predicted upside until a sudden intraday sell-off. I have no idea what spooked the market, but the bounce-back was almost as sharp as the drawdown. This action netted a failure to break presumed resistance at the even number 1800, a temporary break of 20DMA support, and a close that is consistent with a very small and subtle downtrend from the last all-time high.
T2108 took a plunge over 10% at one point. My favorite indicator once again suggests many individual stocks are much weaker than the indices may reveal. The 2-day decline is 11.1%, not quite as quasi-oversold as yesterday’s close. However, the T2108 Trading Model (TTM) projects even higher odds of an upside close to the next day of trading: 86%.
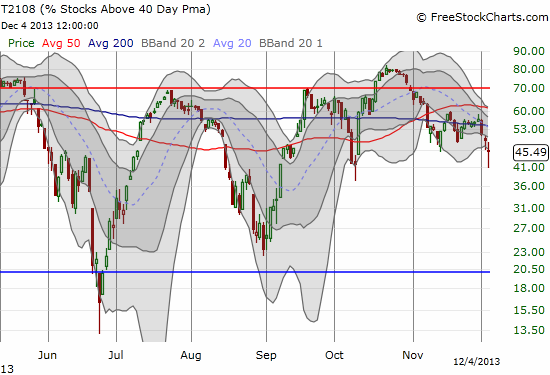 T2108 at near 2-month lows[/caption]
As the chart above shows, T2108 is now near 2-month lows, so a bounce from here makes sense if the fundamental tone of the market remains bullish.
Finally, the volatility index, the VIX, danced our favorite dance around the 15.35 pivot. Failure to hold the highs on the VIX further confirms the lack of conviction by sellers and/or the eagerness of buyers to step into even the smallest dips. With the high odds of upside for trading, shorting (buying puts) on the leveraged VIX products makes sense. A friend gave me a heads up on the trade, but I was too slow to take advantage at the good prices offered when the VIX hit the pivot. I strongly suspect that the biggest drop in volatility could come after Friday’s jobs report since so many are on edge looking for signs the economy is strong enough to encourage the Fed to taper bond purchases.
Daily T2108 vs the S&P 500
")
Black line: T2108 (measured on the right); Green line: S&P 500 (for comparative purposes)
Red line: T2108 Overbought (70%); Blue line: T2108 Oversold (20%)
Weekly T2108

*All charts created using freestockcharts.com unless otherwise stated
Related links:
The T2108 Resource Page
Expanded daily chart of T2108 versus the S&P 500
Expanded weekly chart of T2108
Be careful out there!
Full disclosure: long SSO puts and calls; long VXX