
(T2108 measures the percentage of stocks trading above their respective 40-day moving averages [DMAs]. It helps to identify extremes in market sentiment that are likely to reverse. To learn more about it, see my T2108 Resource Page. You can follow real-time T2108 commentary on twitter using the #T2108 hashtag. T2108-related trades and other trades are posted on twitter using the #120trade hashtag)
T2108 Status: 51.2%
VIX Status: 14.2
General (Short-term) Trading Call: Aggressive traders should short the S&P 500 on a fresh close under 1800.
Active T2108 periods: Day #109 over 20% (overperiod), Day #17 under 60%, Day #22 under 70%
Reference Charts (click for view of last 6 months from Stockcharts.com):
S&P 500 or SPY
SDS (ProShares UltraShort S&P500)
U.S. Dollar Index (volatility index)
EEM (iShares MSCI Emerging Markets)
VIX (volatility index)
VXX (iPath S&P 500 VIX Short-Term Futures ETN)
EWG (iShares MSCI Germany Index Fund)
CAT (Caterpillar)
Commentary
Day #1 after Black Friday and the bears have already scored some progress. Last week, I described Black Friday as the last possible stand for the bears for 2013 and updated the analysis showing the surprising correlation between post-Black Friday trading and weeks and months of trading afterward. With the S&P 500 (SPY) closing below the low of Black Friday trading, the immediate bullish possibilities are over as quickly as I contemplated them.
Next step for the bears is to close the S&P 500 below 1800. Such a move will greatly increase the likelihood of a notable pullback. As I noted in an earlier post, the first close below even numbers (00s) this year has preceded a pullback.
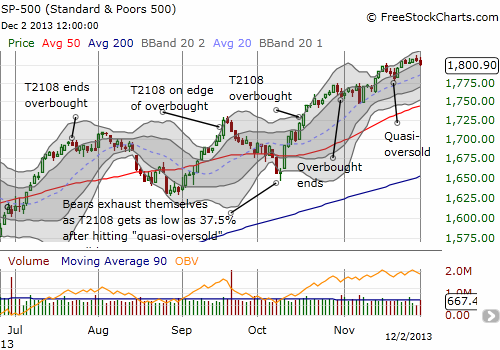
Although the S&P 500 was down only -0.27%, T2108 managed to plunged from 56.8% to 51.2%. The VIX also popped 3.9% to a 6-week closing high. So, once again, a bearish divergence may be developing. Past bearish divergences have proved tricky to play. The last one took almost two weeks to develop and led to just a one-day swoon. If T2108 plunges again tomorrow (Tuesday, December 3), quasi-oversold conditions may nullify, even reverse the bearish momentum. The chart below reminds us what happened after the last quasi-oversold trade.
As always, time will tell.
Daily T2108 vs the S&P 500
")
Black line: T2108 (measured on the right); Green line: S&P 500 (for comparative purposes)
Red line: T2108 Overbought (70%); Blue line: T2108 Oversold (20%)
Weekly T2108

*All charts created using freestockcharts.com unless otherwise stated
Related links:
The T2108 Resource Page
Expanded daily chart of T2108 versus the S&P 500
Expanded weekly chart of T2108
Be careful out there!
Full disclosure: long SSO puts and calls