
(T2108 measures the percentage of stocks trading above their respective 40-day moving averages [DMAs]. It helps to identify extremes in market sentiment that are highly gap down to reverse. To learn more about it, see my T2108 Resource Page. You can follow real-time T2108 commentary on twitter using the #T2108 hashtag. T2108-related trades and other trades are posted on twitter using the #120trade hashtag)
T2108 Status: 51.3%
VIX Status: 14.4
General (Short-term) Trading Call: Should have taken some off the table at the opening surge, otherwise hold.
Active T2108 periods: Day #56 over 20% (overperiod), Day #29 under 50%, Day #80 under 70%
Reference Charts (click for view of last 6 months from Stockcharts.com):
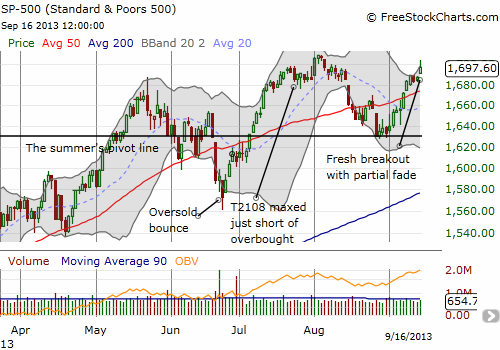
S&P 500 or SPY
SDS (ProShares UltraShort S&P500)
U.S. Dollar Index (volatility index)
VIX (volatility index)
VXX (iPath S&P 500 VIX Short-Term Futures ETN)
EWG (iShares MSCI Germany Index Fund)
CAT (Caterpillar)
Commentary
My stubbornness and careful reads of T2108 paid off today. As the residuals from the “Summers rally” made its final push into the U.S. stock market, I sold my Pro Shares Ultra S&P 500 (SSO) call options for a 115% gain. At the same time, my QQQ call options returned to their peak gain of 50% from last week. Apple (AAPL), much to my chagrin, was the big drag on performance and in due time those call options returned to the small loss I had going into the day. I honestly was caught off-guard. I had a limit order set to sell the calls at the open but set the price too high (the SSO calls went out slightly higher than my limit). It was simply too much for me to process what was going on with AAPL and resolve to dump the QQQ calls at the same time I was trying to guess the strength of the fade. I will write more about AAPL in a separate post!
Events did not unfold as I had scripted when I initiated these positions during quasi-oversold conditions about a month ago, but I will take them. This week has not even unfolded as expected given I thought the main make or break catalyst would be the Federal Reserve and not an announcement from Larry Summers about the end of his candidacy for next Fed Chair (thank goodness). The main lesson from this cycle is that a series of quasi-oversold conditions can provide the catalyst for a bottoming process.
So, NOW we wait on the Federal Reserve.
Daily T2108 vs the S&P 500
")
Black line: T2108 (measured on the right); Green line: S&P 500 (for comparative purposes)
Red line: T2108 Overbought (70%); Blue line: T2108 Oversold (20%)
Weekly T2108

*All charts created using freestockcharts.com unless otherwise stated
Related links:
The T2108 Resource Page
Expanded daily chart of T2108 versus the S&P 500
Expanded weekly chart of T2108
Be careful out there!
Full disclosure: long QQQ calls; long AAPL shares and calls