
(T2108 measures the percentage of stocks trading above their respective 40-day moving averages [DMAs]. It helps to identify extremes in market sentiment that are highly gap down to reverse. To learn more about it, see my T2108 Resource Page. You can follow real-time T2108 commentary on twitter using the #T2108 hashtag. T2108-related trades and other trades are posted on twitter using the #120trade hashtag)
T2108 Status: 46.7%
VIX Status: 14.2
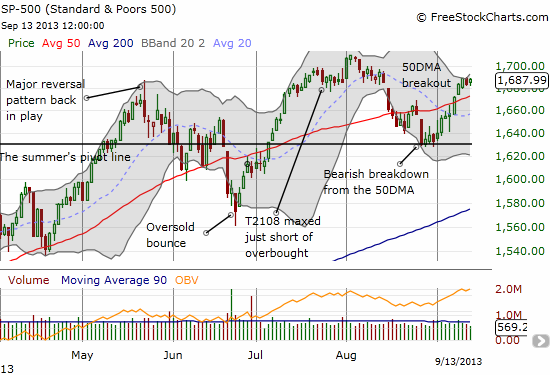
General (Short-term) Trading Call: Hold. Aggressive traders should have already bought the breakout above the 50DMA.
Active T2108 periods: Day #55 over 20% (overperiod), Day #21 under 50%, Day #79 under 70%
Reference Charts (click for view of last 6 months from Stockcharts.com):
S&P 500 or SPY
SDS (ProShares UltraShort S&P500)
U.S. Dollar Index (volatility index)
VIX (volatility index)
VXX (iPath S&P 500 VIX Short-Term Futures ETN)
EWG (iShares MSCI Germany Index Fund)
CAT (Caterpillar)
Commentary
In the last update I stated my resolve to hang on to my standing call options in ProShares Ultra S&P500 (SSO) and PowerShares QQQ (QQQ). At the time, they had moved to flat and up 50% respectively, but I was looking toward a follow-up to the breakout. By Friday, the S&P 500 had gained only marginally and the market’s tepid response to Apple’s (AAPL) product announcements stopped QQQ in its tracks. So, I am now back to losses on both. With hindsight, it would of course have been great to trade in the two birds in the bush for the bird in hand, even better if I had loaded up when T2108 got close to oversold on the last trading day of summer (August 30th). But this is all part of the ups and downs for trading. Now, I have one week to go and a Federal Reserve meeting sitting squarely in the way.
The market seems to be laying in wait now for the outcome of this meeting. I am honestly amazed stocks are levitating as high as they are right now given the big fear not long ago was that the Fed would take away the goodies in the form of bond buying. Now, either the market does not care, has concluded that the economy really no longer needs this assistance, and/or thinks the Fed will stand down. Whatever the reason, I think it is worth seeing this position through its logical conclusion. It is boom or bust: big gains from a strong follow-through to the breakout or big zero from a sharp reaction downward.
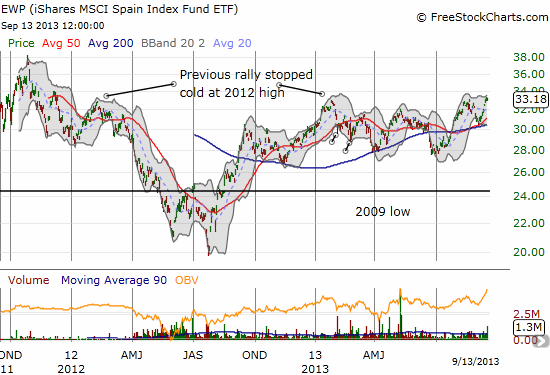
There are a lot of examples out there that demonstrate the market’s teflon texture regarding the potential coming of bond tapering. I have talked about iShares MSCI Emerging Markets (EEM) before. Here is another telling sign: iShares MSCI Spain Capped Index (EWP). I had written earlier this year that I thought EWP had topped out for some time to come. Yet, here we are. Interest rates higher, unemployment just as bad as ever in Spain, and its ETF at new highs for the year and levels last seen December, 2011.
The opportunity in a market like this is to buy the dips. Thus, my HUGE interest in oversold conditions. The other opportunity is likely in hedging. The market has levitated so much, shaken off and ignored so many negative catalysts, that we can imagine complacency is earning compound interest. When/if something truly bad happens, it will likely cause a tremendous sell-off. Bears are counting on this and keep talking about various timelines for it. I do not think this chatter is too useful, at least not yet. I DO think monitoring T2108 will at least keep me on my toes and cognizant of the real context within which trading is happening.
Daily T2108 vs the S&P 500
")
Black line: T2108 (measured on the right); Green line: S&P 500 (for comparative purposes)
Red line: T2108 Overbought (70%); Blue line: T2108 Oversold (20%)
Weekly T2108

*All charts created using freestockcharts.com unless otherwise stated
Related links:
The T2108 Resource Page
Expanded daily chart of T2108 versus the S&P 500
Expanded weekly chart of T2108
Be careful out there!
Full disclosure: long SSO and QQQ calls; long EEM puts; long AAPL shares and calls