
(T2108 measures the percentage of stocks trading above their respective 40-day moving averages [DMAs]. It helps to identify extremes in market sentiment that are highly likely to reverse. To learn more about it, see my T2108 Resource Page. You can follow real-time T2108 commentary on twitter using the #T2108 hashtag. T2108-related trades and other trades are posted on twitter using the #120trade hashtag)
T2108 Status: 41.0%
VIX Status: 14.7
General (Short-term) Trading Call: Aggressive traders can play for a bounce from 50DMA
Active T2108 periods: Day #36 over 20% (overperiod), Day #8 under 50% (underperiod), Day #60 under 70%
Reference Charts (click for view of last 6 months from Stockcharts.com):
S&P 500 or SPY
SDS (ProShares UltraShort S&P500)
U.S. Dollar Index (volatility index)
VIX (volatility index)
VXX (iPath S&P 500 VIX Short-Term Futures ETN)
EWG (iShares MSCI Germany Index Fund)
CAT (Caterpillar)
Commentary
Eight days ago I noted that the sagging T2108 seemed to indicate a waning momentum in the stock market. However, the subsequent slow drip in T2108 completely lulled me to sleep. I even tweeted at one point that someone should wake me when the alarm sounds. Today, the alarm sounded…the momentum has ended.
The daily candlestick chart shows the steady decline in T2108 since it came within a hair of flipping overbought on July 23rd and 24th, prompting me to ponder whether this was “close enough” to start building bearish bets. Turns out the answer was yes.
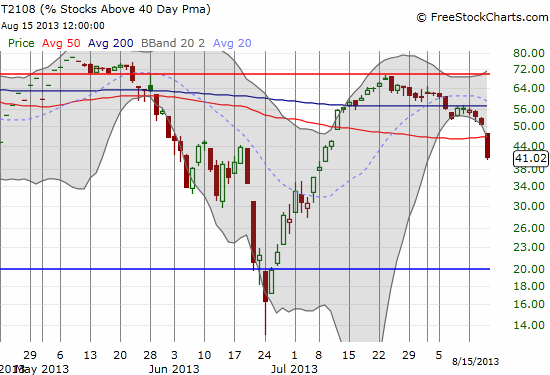
What threw me off the bearish scent for a while was the impressive breakout on August 1st. At the time, I interpreted the combination of sub-overbought levels and new all-time highs as a bullish divergence. I had been calling the setup “room to run.” Yet, I kept one eye on this telling chart which shows the historical performance of the S&P 500 for the 70% underperiod.
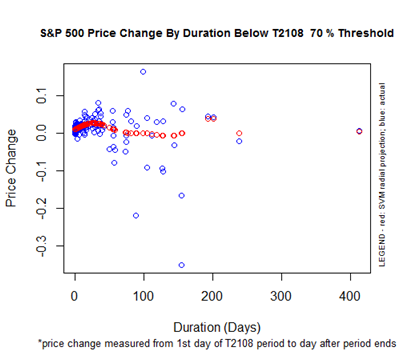
Today is the 60th straight trading day that T2108 has traded below the 70% threshold. Note that the projected performance now has a negative bias and the downside scenarios widen considerably. I should have been tentatively buying SSO puts about 10 days ago. The S&P 500 (SPY) is now almost exactly flat with the close of that fateful day of May 22nd when the index printed an apparent reversal pattern and a top. If the S&P 500 somehow flipped overbought overnight, it would perform almost exactly as expected.
The plunge in T2108 was matched by a plunge in the S&P 500 to the tune of -1.43%. Note the sleepy way in which the index finally reached this sell-off.
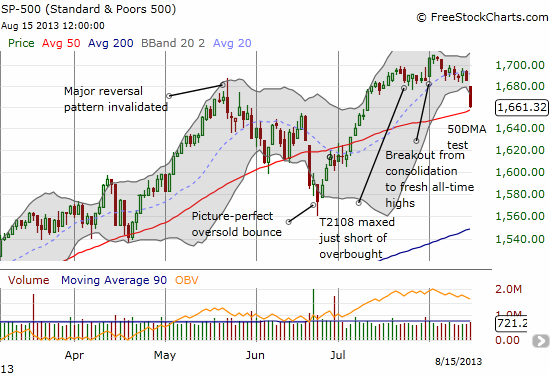
Before sharpening the carving knives, the obvious setup here is with a retest of 50DMA support. In June this support produced two nice bounces before giving way to the late June breakdown. I used the quasi-oversold model to trigger trading opportunities at that time. This time around, the quasi-oversold model is once again producing a screaming buy with 78% odds of an up day on Friday. However, this is based on just 9 occurrences of this particular scenario: T2108 closes below 41.7%% and greater than or equal to 19.2%, the one-day change in T2108 is less than -2.5%, and the 2-day change is greater than or equal to -24.0%. I did not initiate the standard SSO calls, but I did load up on QQQ September call options (part of putting my mouth where my betting is with some friends on the NASDAQ’s closing and high by the end of September). If the market dips on Friday, I will start in on the SSO calls and will look to sell them into the first bounce.
I have been using and tweaking the Apple Trading Model (ATM) but will have to write about some important lessons learned in another post. If you have not see it yet, please read my piece “Icahn Secures Apple’s Bottom.”
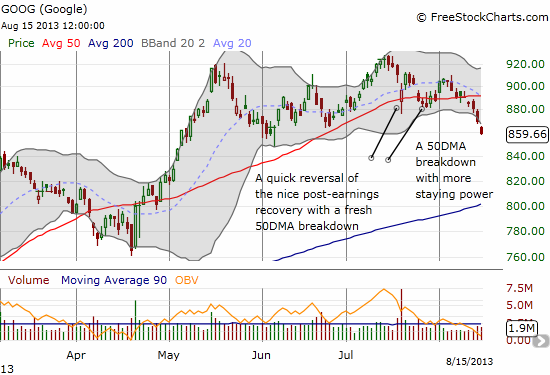
This sell-off produced some interesting charts of course. In particular, my trade on a call spread for Google (GOOG) will end on Friday as a bust. I thought GOOG was well on its way through a post-earnings recovery and new all-time highs. Instead, the stock is breaking DOWN again. It is over-stretched now, but the technicals say to fade relief rallies until a retest of the 50DMA…which is now resistance. I also need to discard my $1000 target.
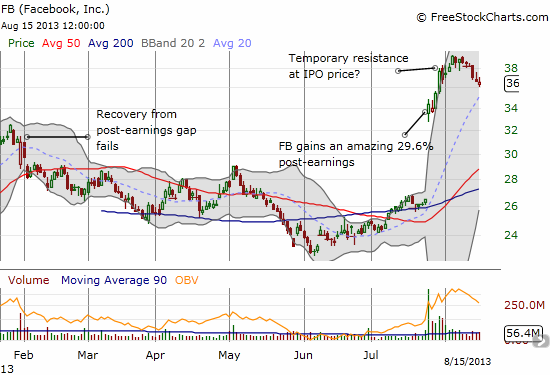
Another chart of interest is Facebook (FB). I described my strategy in freshly shorting FB. It is looking suspiciously like the IPO price of $38 is going to serve as a cap on the stock. I hope everyone who needed to bail, did so. The market delivered a rare gift in bringing to life a busted IPO. FB needs to hold the 20DMA to maintain some element of bullishness.
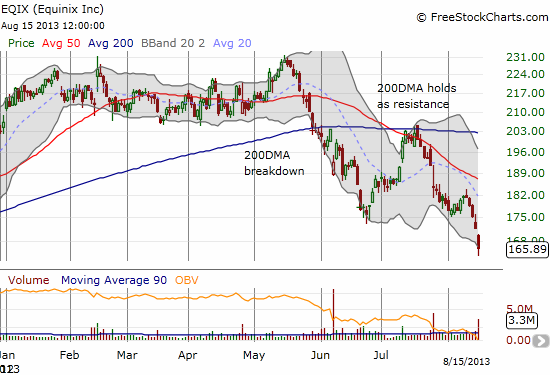
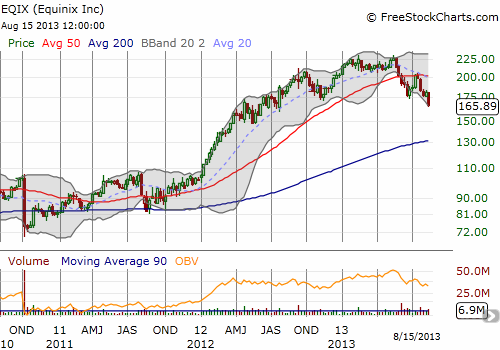
Finally, an interesting development in seeing former high-flyer Equinix (EQIX) cracked a new 52-week low. EQIX was just at an all-time high in May. In 2012, it was one of the best (if not THE best?!) performing stocks of the big-caps in the NASDAQ. While folks were gushing about AAPL’s run for the first 9 months, EQIX was quietly out-performing AAPL most of the way. The lesson from AAPL’s fall from all-time highs is that EQIX’s quick tumble to 52-week lows is a very bearish sign that may be sustained for quite some time.
Daily T2108 vs the S&P 500
")
Black line: T2108 (measured on the right); Green line: S&P 500 (for comparative purposes)
Red line: T2108 Overbought (70%); Blue line: T2108 Oversold (20%)
Weekly T2108

*All charts created using freestockcharts.com unless otherwise stated
Related links:
The T2108 Resource Page
Expanded daily chart of T2108 versus the S&P 500
Expanded weekly chart of T2108
Be careful out there!
Full disclosure: long AAPL shares and call spread, short FB and long calls, long GOOG call spread, long QQQ calls