
(T2108 measures the percentage of stocks trading above their respective 40-day moving averages [DMAs]. It helps to identify extremes in market sentiment that are highly likely to reverse. To learn more about it, see my T2108 Resource Page. You can follow real-time T2108 commentary on twitter using the #T2108 hashtag. T2108-related trades and other trades are posted on twitter using the #120trade hashtag)
T2108 Status: 60.3%
VIX Status: 13.5
General (Short-term) Trading Call: Aggressive traders who got long the breakout should be finished locking in profits.
Active T2108 periods: Day #25 over 20% (overperiod), Day #11 over 60%,Day #52 under 70%
Reference Charts (click for view of last 6 months from Stockcharts.com):
S&P 500 or SPY
SDS (ProShares UltraShort S&P500)
U.S. Dollar Index (volatility index)
VIX (volatility index)
VXX (iPath S&P 500 VIX Short-Term Futures ETN)
EWG (iShares MSCI Germany Index Fund)
CAT (Caterpillar)
Commentary
T2108 is not where I thought it would be pre- or post-Fed. T2108 continues to sag, closing essentially flat with the previous day at 60.3%. The S&P 500 went essentially nowhere for the fifth day in a row in what is starting to look like a consolidation pattern ahead of a fresh run-up.
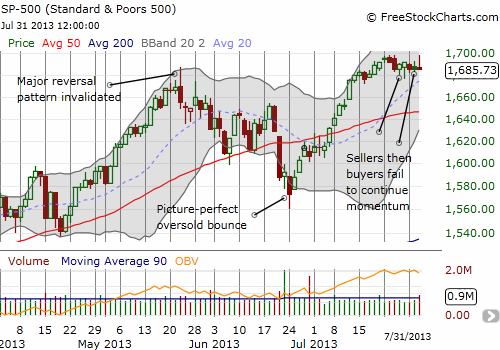
The S&P 500 managed to get as high as a new intraday high before pulling back on a weak close. The fades of the past two days are mirror images of the strong bounces from lows last week. What looked like a springboard now looks like a stalemate until consolidation finishes. Tomorrow is the first day of the month, so the bias will be towards strong upside. This could be the catalyst for a fresh rally upward…as long as the jobs report on Friday does not disappoint traders (hard to know now whether they want a soft or a good report since a good report presumably brings the Fed that much closer to removing easy money stimulus).
So, overall, there is little T2108 can do to help us until this consolidation gets broken one way or the other. I currently have no particular inclination either way, but if forced to bet, I would bet on upside and overbought conditions.
While the S&P 500 has bored us to tears, individual stocks and other indices have delivered plenty of action.
On the ominous side, the Nikkei (EWJ) (NKY) looks like it has slowed down significantly. With the Japanese index cracking its 50DMA again, more downside potential opens up. The overall pattern is a classic one to short as the previous high is a lower high. The Nikkei can only restore momentum by overcoming this high. Similarly, if it breaks the recent low (from June), the Nikkei will have a definitive downtrend in place that will likely encourage more selling.
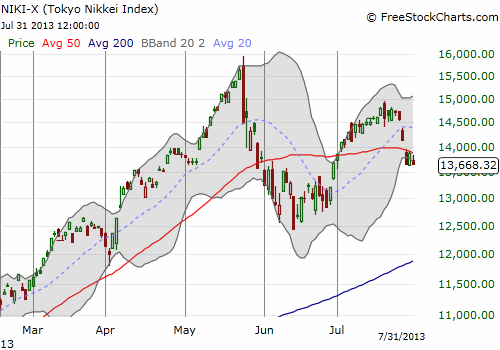
This weakness is important because it is now coinciding with a strengthening cycle for the Japanese yen (USD/JPY) (FXY) and an S&P 500 which has failed to make progress since new all-time highs a week ago. For more analysis on the connections across the Nikkei, yen, and the S&P 500 see my Seeking Alpha piece “The Yen, The Nikkei, And The S&P 500: Watch The Trends And Correlations.”
The iShares MSCI Emerging Markets (EEM) has failed to break its 50DMA resistance for 7 straight days. EEM is now following its 50DMA downward. When combined with the recent acceleration in the downward push of the Australian dollar (AUD/USD), I strongly suspect a fresh breakdown is coming for EEM.
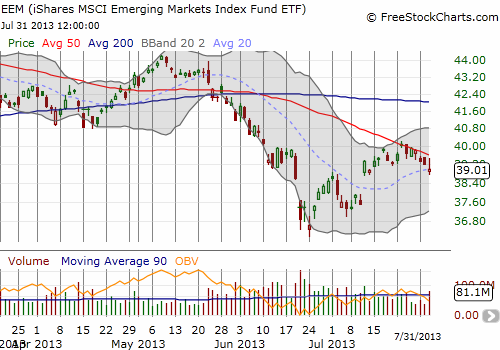
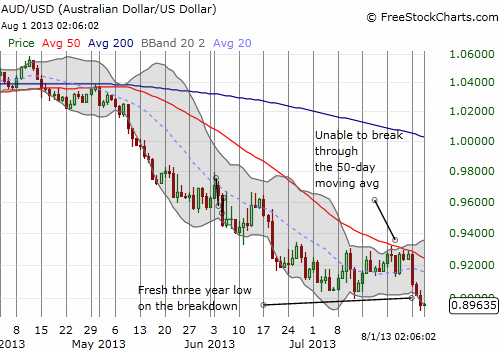
Add these downward trends to the sagging Nikkei, and I start to doubt whether the S&P 500 can stay aloft much longer.
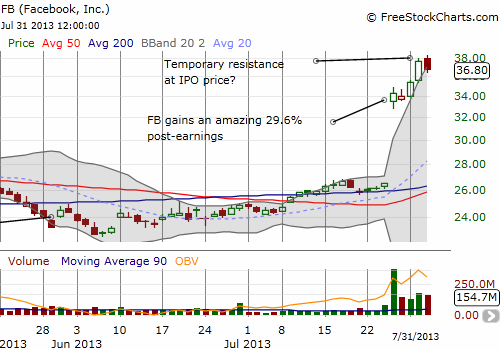
Next up is Facebook (FB). In my last T2108 Update, I discussed my FB trading strategy. Soon after that, I changed course. I realized that the best way to play an eventual reversal is not to wait patiently for a good entry and buy puts just in case FB falls before I set up my position. Instead, I need to build up a short position and buy call options as hedges.
I did just that on Tuesday buy shorting a few shares and buying a few September $40 call options. Much to my surprise, FB shot up shortly thereafter and by today’s open, my FB calls were already closed out for a 150% gain (I wish I had bought more!). Today’s fade on FB after perfectly hitting the IPO price of $38 is suggestive, but the rally may be far from over. FB is capturing imaginations again, and analysts are rapidly upgrading the stock and hiking up revenue and earnings expectations. I will have more to say about this in a separate post. Suffice to say that when dreams expand, the courage increases to try buying high and selling even higher.
Last but certainly not least, is Apple (AAPL). AAPL had another strong start to the week and stalled right at the resistance I pointed out last time. Granted, I did NOT expect AAPL to test the resistance level so soon. Follow-through will be important here. Without it in the next few days, I strongly suspect AAPL could fall quickly back to its 50DMA (I think the gap up is “safe”). I remain bullish, and this week’s strong start provided early evidence or confirmation of my standing assumption that AAPL will be one of the perfect “catch-up” stocks for hedge funds who find themselves lagging the market with the clock quickly ticking.
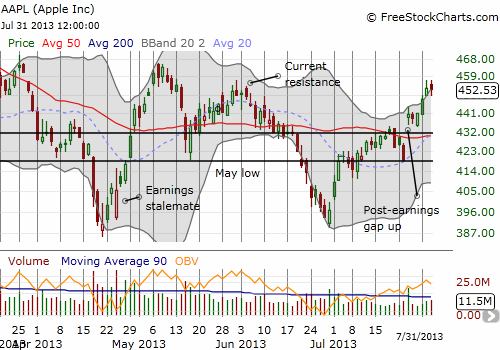
For details on my now formalized Apple Trading Model (ATM) see “ATM: The Apple Trading Model Formalized.”
Finally, a friend of mind sent me interesting reading from a Seeking Alpha author who speculates on reasons why the market is not correcting “like it should” in “UVXY Inflows Reveal A Strange Paradox That Could Be Preventing A Market Correction.” While I do not like the notion of arguing with the market over what it should and should not be doing, I was very intrigued by the possibility claimed here that the VIX is not representative of true fear in the market. Instead of buying puts on the S&P 500 (SPY), which are used to calculate the VIX, traders are using ProShares Ultra VIX Short-Term Futures ETF (UVXY) instead. Volume has indeed surged on UVXY since March and particularly going into June’s bottom, but the rapid decline in UVXY suggests that traders buying and holding UVXY have been quite wrong in betting on fear. The losses on UVXY over 2013 are massive.
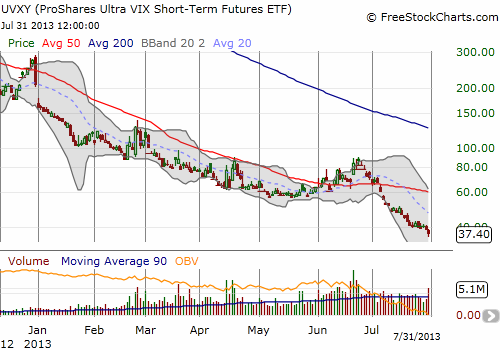
We must also be cautious about interpreting volume. The money committed to UVXY may actually not be increasing all that much. In just over a month, UVXY has collapsed more than 50% but volume has not doubled. That means LESS money may be going into UVXY. Moreover, there are many ways traders can express their fear in financial markets, including the bonds of the U.S government, which, until recently, were a great place to hide out.
Anyway, it is something to keep in mind while watching the VIX continue to languish. I have yet to buy more puts against my small number of iPath S&P 500 VIX Short-Term Futures ETN (VXX) shares: still waiting for a bounce to fade…
Daily T2108 vs the S&P 500
")
Black line: T2108 (measured on the right); Green line: S&P 500 (for comparative purposes)
Red line: T2108 Overbought (70%); Blue line: T2108 Oversold (20%)
Weekly T2108

*All charts created using freestockcharts.com unless otherwise stated
Related links:
The T2108 Resource Page
Expanded daily chart of T2108 versus the S&P 500
Expanded weekly chart of T2108
Be careful out there!
Full disclosure: long AAPL shares and puts; short FB and long FB puts; long EEM puts and put spread; long VXX; net short Australian dollar, net long Japanese yen