
(T2108 measures the percentage of stocks trading above their respective 40-day moving averages [DMAs]. It helps to identify extremes in market sentiment that are highly likely to reverse. To learn more about it, see my T2108 Resource Page. You can follow real-time T2108 commentary on twitter using the #T2108 hashtag. T2108-related trades and other trades are posted on twitter using the #120trade hashtag)
T2108 Status: 36.1%
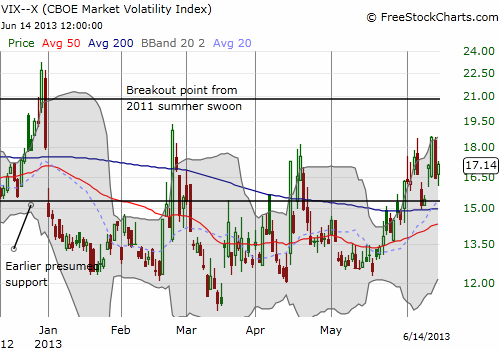
VIX Status: 17.1
General (Short-term) Trading Call: Play the wedge – breakout or breakdown
Active T2108 periods: Day #4 under 40% (underperiod), Day #16 under 70% (underperiod)
Reference Charts (click for view of last 6 months from Stockcharts.com):
S&P 500 or SPY
SDS (ProShares UltraShort S&P500)
U.S. Dollar Index (volatility index)
VIX (volatility index)
VXX (iPath S&P 500 VIX Short-Term Futures ETN)
EWG (iShares MSCI Germany Index Fund)
CAT (Caterpillar)
Commentary
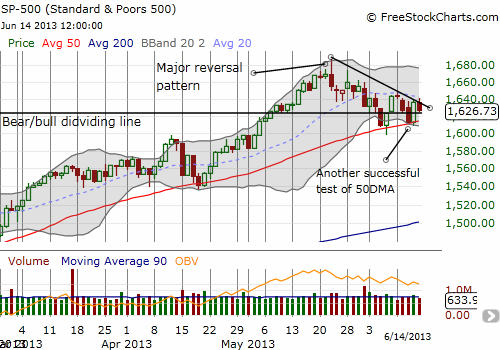
Incredibly, the tightening wedge on the S&P 500 remains mainly intact.
If I had to vote based on the VIX, the volatility index, I would vote for a breakdown. The VIX remains resilient and is now staying “aloft” for its longest duration of the year. For 10 of the last 11 trading days the VIX has closed above the 15.2 pivot. While the S&P 500 has churned, the VIX has strengthened its resolve. This resilience should be warning us of elevated concern for a resumption of the S&P 500’s correction.
June 13th
- In response to today’s economic data, Goldman Sachs has lowered its Q2 Real GDP tracking by one-tenth to 1.6%. Growth slowing. #stockaction
- I love gold! http://www.youtube.com/watch?v=sr0gNJ090JA …
- Retweet from zerohedge: If There Is A “Housing Recovery” Then This Chart Can’t Be Right http://www.zerohedge.com/news/2013-06-13/if-there-housing-recovery-then-chart-cant-be-right …
- What ever happened to Goldman Sachs’ recommendation to go long Nikkei last Friday nite? #stockaction
- @JamesGayleLaw I accept all info/data from permabears and permabulls – then interpret it myself.
- @danielchae haters gonna hate – i was just curious if they stopped themselves out. when they went long iwm a few weeks ago i gave them kudos
- Again.. the market without memory from day to day! UP DOWN UP DOWN UP ?
- I have feared since last September that Apple would be unable to move the needle with new product offerings. Copycat? http://www.foxnews.com/tech/2013/06/13/apple-reportedly-considering-creating-bigger-cheaper-iphone/ …
- @MJSingh23 haters gonna hate
- First non GLD trades of the day. I have shorted SPY at 162.74 and IWM at 97.58 now.
- Regardless of view, no memory from day to day. Buy dips, sell rips for now.
- Rejoice in the randomness, reject confidence of view in an uncertain setting.
- Adding to index shorts on a scale now.
- god awful auction of 30 years!
- 1624 Roadblock for the S&P? $SPY
- @laassya technical voodoo.
- Crickets from Bears – A roar from Bulls.
- Algos at war with fractals now! #stockaction
- Repeating – There is no special sauce to beat Mr. Market. Special sauce is for pasta eating not for stock forecasting. #stockaction
- Retweet from zerohedge: Hilsenamnesia: “when the Fed shuts off bond buying, it won’t be abrupt and it won’t be predictable” May 22, 2013
- Now up on RealMoneyPro: The Quants Strike Again in the Hilsen-Rescue http://blogs.wsj.com/economics/2013/06/13/fed-likely-to-push-back-on-market-expectations-of-rate-increase/?mod=WSJ_hps_LEFTTopStories …
- @Copernicus2013 Zero Hedge doesnt go long or short stocks. It is a blog that expresses a thoughtful and analytical view. Not advice.
June 14th
- China’s Finance Ministry failed to sell all of the debt offered at an auction for the first time in 23 months
- This volatile market is not for old man, those slow of response, those that leave the trading desk or investors. For opportunistic traders.
- WSJ Refis plunge – threaten housing’s recovery and retail sales (savings rate at five year low) – been my view http://online.wsj.com/article/SB10001424127887324049504578543740366352164.html?mod=WSJ_hp_LEFTWhatsNewsCollection …
- WSJ Tax credits buoyed first quarter corporate profits – earnings quality also has been one of our concerns. http://online.wsj.com/article/SB10001424127887324049504578543324262064306.html?mod=WSJ_hp_LEFTWhatsNewsCollection …
- Yesterday algos went wild and a not surprising Hilsenrath WSJ article were the proximate causes of the sharp ramp. I exp some retrace
- I paid 133.53 for more GLD just now. $GLD
- I love Gold! http://www.youtube.com/watch?v=DOFAnpb8I3E …
- Shorting more QQQ at 72.72 in premarket trading now. $QQQ
- @DividendMaster Gold is a trading sardine not an eating sardine
- Productivity dropping, PPI rising, pricing power non existent, oil vey (crude up) – profit margins will be threatened.
- Manufacturing growth slowing: industrial production/capacity utilization just out.. below March levels. #stockaction
- Pressed shorts QQQ 72.72, IWM 98.43 and SPY 164.45 $SPY
- Repeating for emphasis – Mr Market has no memory from day to day. Buy dips, sell rips and be opportunistic. Trendless.
- Retweet from zerohedge: Stunning Images From China: Ten Thousand People Waiting In Line To Buy Gold http://tinyurl.com/oz2t896
- I wanted to tweet at yesterday’s close – that Thursday rally was one of the most absurd and unjustified that I have ever witnessed But didnt
- I shorted more indices instead.
- Off of most radar screens is the election today for a new president of Iran Whether a reformist or hard liner wins could impact risk markets
- Largest buy today – TWM (ultra short Russell) $TWM
- Everyone have a great Father’s Day! Take the high road because….Haters Gonna Hate http://finance.yahoo.com/news/dialing-back-haters-best-kass-154200271.html …
Mind you – I took just a sample. Kass has become extremely prolific on twitter and clearly spends a lot of time tweeting and reading tweets during the trading day (especially Zero Hedge pieces).
Note I am NOT making fun of Kass here. I have a lot of respect for him and his consistent ability to stick firm to a contrarian viewpoint. I follow his tweets and even set it up so I get text messages on my phone. By following him so closely I have come to recognize a lot of patterns and consistent communication styles (also making me wonder what patterns I have!).
In particular, Kass predictably starts posting positively on the market after a sell-off that takes it low enough below some price target he has and negatively on the market when it is rallying above his target. A notable exception is the cheerleading of any stock he is holding that is rallying. In THAT case, he becomes similar to the rest of us who enjoy celebrating success on twitter. I did not post examples of those tweets. However, in all the time he has been hyping gold it has mainly churned in place, little different from the “memoryless” market he complains about when referring to the S&P 500. Confirmation bias is a tough habit for any of us to kick.
Why care about what Kass has to say? He has a large audience of almost 63,000 followers. In the investing and trading world this is a huge sphere of influence. It has the potential to move positions in some cases. Kass is also well-known for making some big market calls, especially calling a bottom in March, 2009. He is a regular guest on CNBC and has a well-known active love/hate relationship with the infamous Jim Cramer. Most importantly, he drops nuggets of insight that serve as a check on my own biases. I just wish I could get him to answer more of my tweets to him. 🙂
Anyway, sorry for the large sidetrack on Kass, but this is context to the action on Thursday. Kass fought the rally all day and in the end concluded that quants went crazy using algorithms to drive the market in the “wrong” direction. My eyes perked up because my own algorithm in the form of the T2108 Trading Model (TTM) had predicted a down day based on Wednesday’s close. I was instead positioned for a rally given the TTM earlier Wednesday predicted a rally if the market had closed when I checked it intraday. (See the last T2108 Update for details). Kass reminded me that my own model and algorithms are competing with others coming to their own conclusions.
In Thursday’s case, even the dumbest algorithm could have made one of two simple simple conclusions: 1) short on the break of the 50DMA, or 2) BUY a retest of the 50DMA. The shorts got it wrong and were likely reminded that these signals are best followed AFTER a close and maybe even confirmation with follow-through on the next day. Kass also thinks of technicals as voodoo although he freely picks and chooses technical perspectives that agree with his own analysis. On Thursday, I took note of his awareness of 1624 on the S&P 500 as technical resistance. It easily gave way. As the chart above shows, this bear/bull dividing line has quickly matured from simple support and resistance to an important pivot point, a true dividing line. I am guessing Kass would not have hated the quants so much on Thursday if their algorithms had respected this line as resistance!
Anyway, I was very fortunate to make profits on my large gathering of SSO calls. I was grateful even though my early exit left about another 33% on the table by the Thursday’s close. The lesson I got from this experience is that I need to run a sensitivity analysis on the T2108 Trading Model. I plan to add code to test out the robustness of the prediction if any one of the parameters deviates by a “reasonable” amount. It will be like a voting machine (for you machine learning types, think Adaptive Boosting or AdaBoost). If the preponderance of votes lean in the direction of the main prediction based on the close, I will increase my confidence in the prediction. I hope to make this adjustment in the coming weeks. In the meantime, I will stick with the current method and try to do some manual sensitivity checks that will include examining the decision tree for the classification model for any quirks that would make the current prediction prone to instability.
In summary, I expect the S&P 500 to break out of this wedge in the coming week, most likely driven by a Fed-inspired reaction and/or counter-reaction. Out of respect for T2108, I am leaning bullish, but I will instantly turn bearish on a CLOSE below the 50DMA that gets follow-through. NOTE WELL – I am not likely to trade on that bearishness, at least not on the S&P 500, because at that point T2108 should be rapidly approaching oversold conditions. I am VERY eager to test out the TTM and my overhauled T2108 methods on oversold conditions. Just as I did not get automatically bearish with overbought conditions (thank goodness!), I will not get automatically bullish with classic oversold conditions. I will run the numbers and respect the odds…and the technicals.
Finally, two more important trades I announced on twitter: I am again long puts on Caterpillar (CAT) that turned out well-timed as CAT failed to break resistance at its 50DMA. I also dove right back into puts on First Solar (FSLR) after it cracked $45 (I really should have just stuck with my previous put spread and stayed as patient as I was coming into the sell-off – they did not expire until July).
Daily T2108 vs the S&P 500
")
Black line: T2108 (measured on the right); Green line: S&P 500 (for comparative purposes)
Red line: T2108 Overbought (70%); Blue line: T2108 Oversold (20%)
Weekly T2108

*All charts created using freestockcharts.com unless otherwise stated
Related links:
The T2108 Resource Page
Expanded daily chart of T2108 versus the S&P 500
Expanded weekly chart of T2108
Be careful out there!
Full disclosure: long CAT shares and puts; long FSLR puts; long GLD